Network bandwidth monitoring is essential for system administrators to track data usage, analyze traffic patterns, and optimize network performance.
VnStat PHP has been a popular choice due to its simple web-based interface, but it lacks modern features like real-time monitoring, deep packet inspection, and advanced visualizations. Moreover, it is no longer actively maintained, making it less suitable for modern network monitoring needs.
If you’re looking for powerful, modern alternatives, this guide covers the top five best replacements for VnStat PHP that provide better insights, interactive dashboards, and enhanced reporting capabilities.
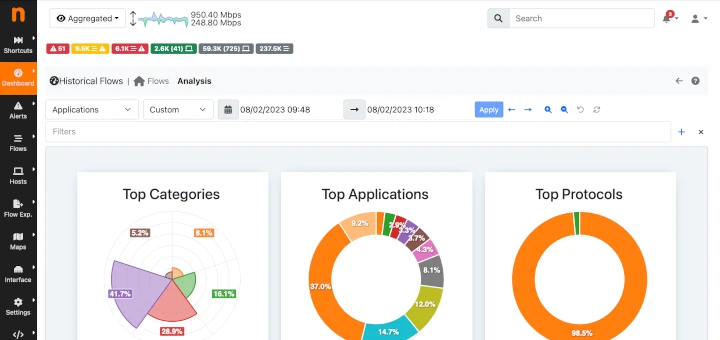
1. Ntopng – Web-Based Traffic and Security Network Monitoring
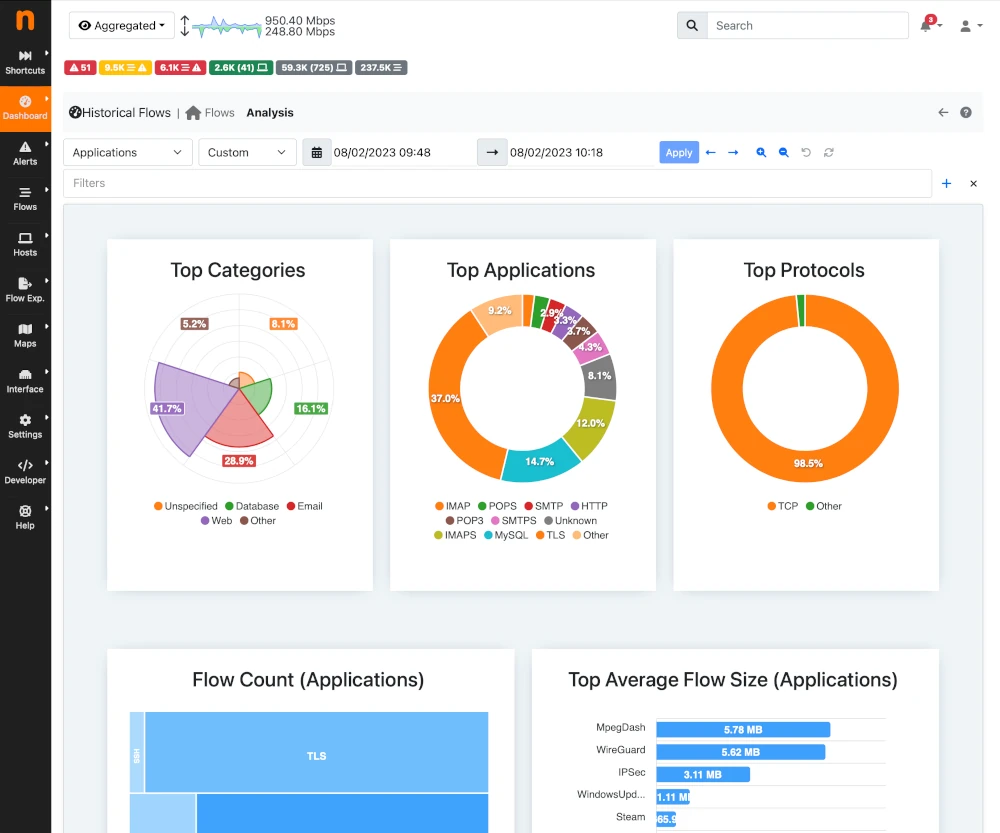
ntopng is a powerful network traffic monitoring tool that offers complete network visibility. It gathers traffic data from multiple sources, including traffic mirrors, NetFlow exporters, SNMP devices, firewall logs, and intrusion detection systems.
Designed for cross-platform compatibility, ntopng runs on Linux, FreeBSD (including pfSense and OPNsense), macOS, and Windows.
It captures network traffic using libpcap or PF_RING (on Linux) for optimal performance. Alternatively, it can work with nProbe to collect NetFlow/sFlow data from routers and switches or with nProbe Cento to analyze high-speed 100 Gbps links in real-time.
Unlike VnStat PHP, Ntopng offers real-time network monitoring, deep traffic analysis, and an interactive web UI, making it a robust choice for modern network monitoring.
To install Ntopng on Linux, use the following appropriate command for your specific Linux distribution.
sudo apt install ntopng         [On Debian, Ubuntu and Mint]
sudo dnf install ntopng         [On RHEL/CentOS/Fedora and Rocky/AlmaLinux]
sudo emerge -a sys-apps/ntopng  [On Gentoo Linux]
sudo apk add ntopng             [On Alpine Linux]
sudo pacman -S ntopng           [On Arch Linux]
sudo zypper install ntopng      [On OpenSUSE]
sudo pkg install ntopng         [On FreeBSD]
Access the web interface at http://localhost:3000.
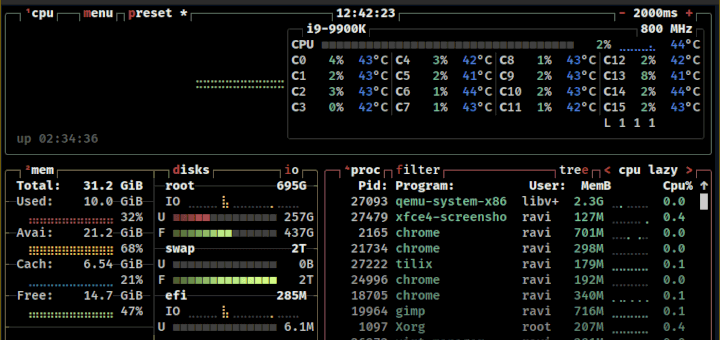
2. Netdata – Real-Time Performance Monitoring
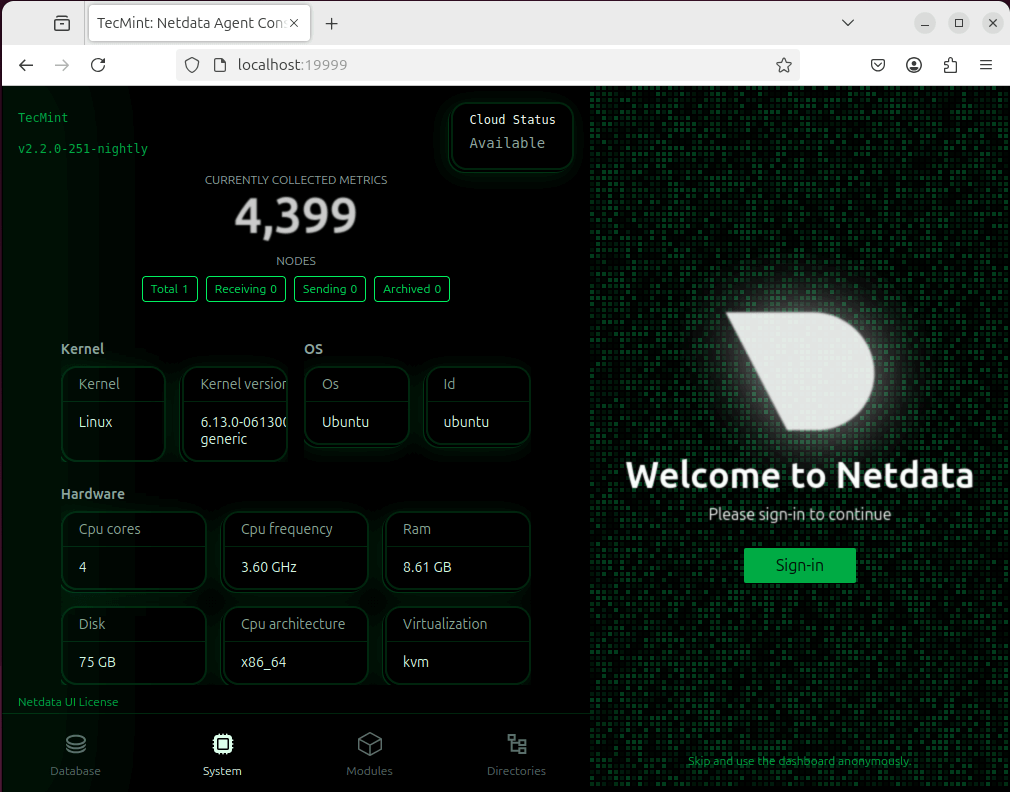
Netdata is a powerful real-time monitoring tool that provides detailed insights into network, system, and application performance by offering live metrics, interactive dashboards, and AI-powered anomaly detection.
Netdata supports auto-detection of system components, low-latency data collection, and cloud integration for remote monitoring. The web-based interface provides second-level precision, making it ideal for troubleshooting performance issues.
With minimal resource usage, Netdata efficiently tracks CPU, memory, disk, and network activity in real-time. Its scalability and ease of setup make it a great choice for both home users and enterprises.
Netdata can be installed on most Linux distributions with a single wget or curl command:
wget -O /tmp/netdata-kickstart.sh https://get.netdata.cloud/kickstart.sh && sh /tmp/netdata-kickstart.sh
OR
curl https://get.netdata.cloud/kickstart.sh > /tmp/netdata-kickstart.sh && sh /tmp/netdata-kickstart.sh
Access it via http://server-ip:19999 after installation.
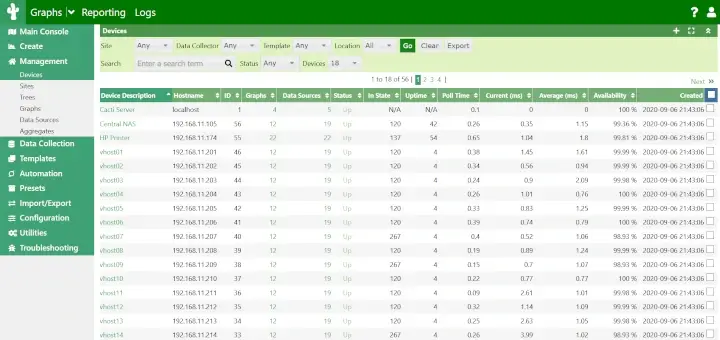
3. Cacti – Scalable Network Monitoring and Graphing
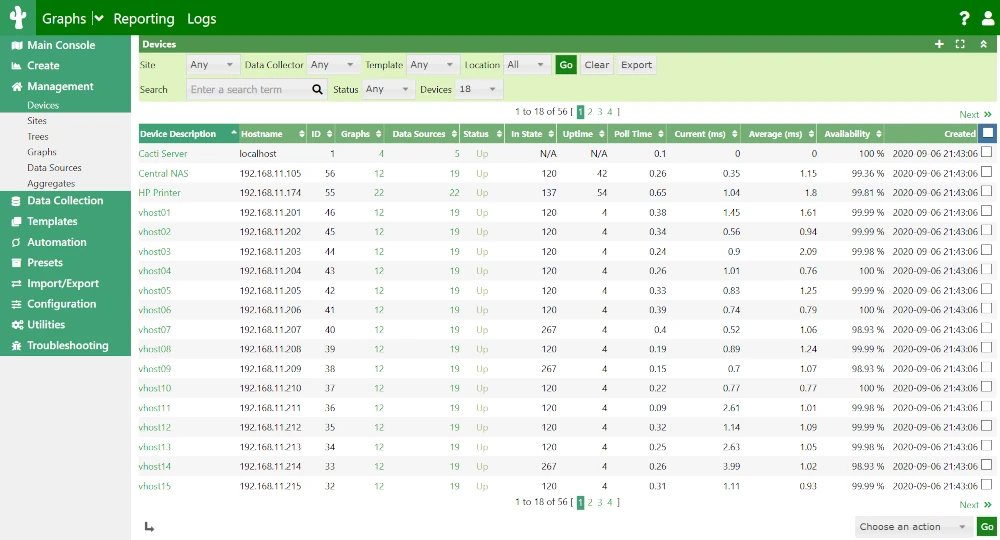
Cacti is a powerful, open-source network monitoring and graphing tool designed to provide detailed insights into system performance using RRDtool for data storage and visualization.
It allows administrators to monitor network bandwidth, CPU usage, memory consumption, and other system metrics through an intuitive web-based interface.
With support for SNMP (Simple Network Management Protocol), Cacti can track multiple devices, including routers, switches, and servers, making it ideal for large-scale deployments.
It features customizable templates, automated data collection, user authentication, and advanced graphing capabilities, allowing users to create detailed performance reports.
Whether for small networks or enterprise-scale infrastructures, Cacti delivers efficient, scalable monitoring with minimal resource usage, making it a robust alternative to basic bandwidth monitoring tools.
To install Cacti on Linux, use the following appropriate command for your specific Linux distribution.
sudo apt install cacti         [On Debian, Ubuntu and Mint]
sudo dnf install cacti         [On RHEL/CentOS/Fedora and Rocky/AlmaLinux]
sudo emerge -a sys-apps/cacti  [On Gentoo Linux]
sudo apk add cacti             [On Alpine Linux]
sudo pacman -S cacti           [On Arch Linux]
sudo zypper install cacti      [On OpenSUSE]
sudo pkg install cacti         [On FreeBSD]
Access the web interface at http://localhost/cacti after installation.
4. Zabbix – Open Source Network Monitoring
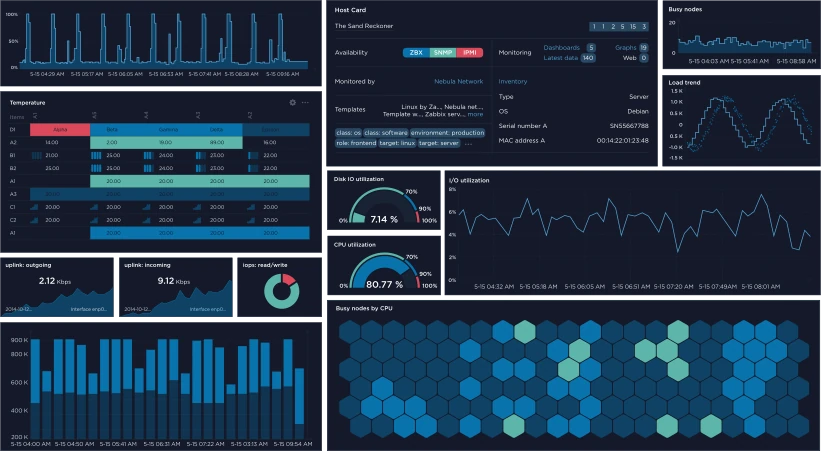
Zabbix is an enterprise-grade, open-source monitoring solution designed for real-time tracking of networks, servers, applications, and cloud infrastructure.
It provides scalability, automation, and advanced visualization through an intuitive web interface, making it ideal for businesses of all sizes. Zabbix supports agent-based and agentless monitoring, collects performance metrics, and sends instant alerts based on customizable triggers.
With built-in machine learning, anomaly detection, and forecasting, it helps administrators proactively identify issues before they impact operations.
Supporting SNMP, IPMI, JMX, and cloud services, Zabbix integrates seamlessly into diverse IT environments. Its robust security, flexible API, and extensive reporting tools make it a powerful choice for modern IT infrastructure monitoring.
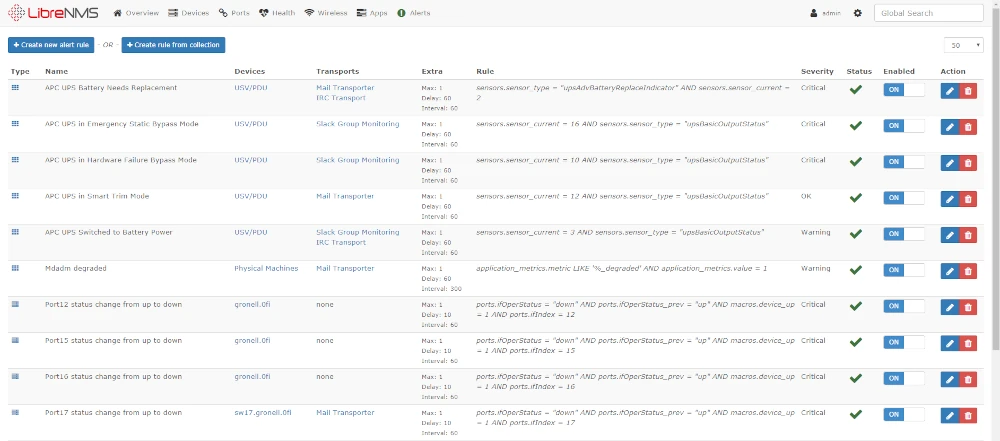
5. LibreNMS – Network Monitoring System
LibreNMS is a powerful, open-source, and feature-rich network monitoring system designed to provide automatic discovery, real-time performance tracking, and alerting for network devices.
It supports SNMP, APIs, and various protocols to monitor routers, switches, servers, and IoT devices across multi-vendor environments. With its intuitive web interface, LibreNMS delivers detailed graphs, customizable dashboards, and historical data visualization, making it easy to analyze traffic trends.
It integrates with Slack, PagerDuty, and email notifications, ensuring timely alerts for network issues. Additionally, LibreNMS supports distributed polling, allowing large-scale network monitoring across multiple locations.
With built-in reporting, mobile app support, and flexible API integrations, it serves as a comprehensive solution for businesses, ISPs, and data centers.
Conclusion
VnStat PHP was once a dependable option, but modern network monitoring demands more advanced, scalable, and actively maintained tools. Today’s solutions offer real-time traffic analysis, deep insights, and enterprise-grade monitoring, making them better suited for evolving network requirements.
With over a decade of Linux expertise, I suggest choosing a tool based on your network size, budget, and monitoring needs. Upgrading to a modern solution ensures better visibility, stronger security, and improved network performance.
If this guide was helpful, share it with your peers and drop your thoughts in the comments below!

The web base is loaded but not showing any data.
with the
vnstat -mcommand all data is available, but all data is 0KB.whats issue?
Everything works to install the vnstat, I did it previously, I got the front end installed in the web server directory but in the interface, none of the data is populated. vnstat on the command line works perfectly.
I have the same issue. It seems to be caused by the change in vnstat version 2.0 and newer, change to SQLite database. I don’t think the PHP frontend will work with that format as it has not been updated since 2010. I will probably have a downgrade to vnstat 1.18.
On Linux Mint 17.3 only need to change this command:
# cp -fr vnstat_php_frontend-1.5.1/ /var/www/vnstat
into:
$ sudo cp -fr vnstat_php_frontend-1.5.1/ /var/www/html/vnstat
i am new to linux i am running linux mint 17.3 i can run vnstat in the terminal and it tells me data usage but i cant get the web browser to work i want to know how much data i am using
@Michael,
Have you installed Apache with all required modules? have you added correct settings about your interfaces in vnstat config.php file? have you opened port 80 on the firewall to access to the vnstat over web? please check these things again and let me know what error you still getting on vnstat web?
Works great thanks for the tutorial :D
There is a spelling mistake in your code.
$ sudo apt-get insatll vnstat
Should be
$ sudo apt-get install vnstat
Yeah Stephen thanks, corrected in the write up..
i love your tutorial, thank you for Posting…
i’ll follow ;)
Pretty good article.
Thanks
Just want to know when eth0 database is created, which type of database it is & if we want to open in another application how can we use it ?
Thanks in advance
Regards,
Sandeep