
top gives you a list of processes, but it does not immediately tell you whether the real problem is CPU, memory, disk I/O, or network activity. You often end up opening free, df, iostat, and ss separately to get the full picture.Imagine receiving an alert that a web server is responding slowly. You SSH into the server and run top. CPU usage looks normal, but that does not rule out memory pressure, disk contention, or heavy network traffic. You need several other commands to investigate each resource.
btop brings much of that information together in a single terminal interface. It displays per-core CPU usage, memory and swap consumption, disk I/O, network throughput, and running processes using live graphs and interactive panels. You can filter and sort processes, inspect resource usage, and customize the interface without leaving the terminal.
btop is the C++ continuation of the earlier bashtop and bpytop projects. Because it runs entirely in the terminal, you can use the same interface on a local machine or over SSH on a remote Linux server.
In this guide, you’ll learn how to install btop, understand its four main panels, filter and manage processes, and customize the interface to make server monitoring faster and more useful.
How btop Collects its Data
Knowing where btop gets its numbers makes its output easier to understand and troubleshoot. It reads system statistics directly from the Linux kernel’s virtual filesystems, primarily /proc for CPU, memory, load, and process information and /sys for hardware-related data such as temperatures.
btop does not require a background daemon, so it stops collecting data as soon as you exit it.
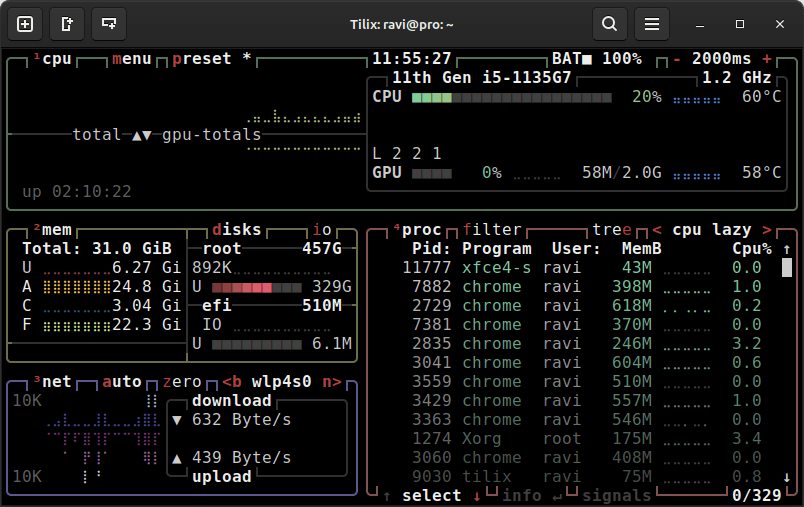
The interface is divided into four main panels. You can use the number keys to show or hide individual panels:
- CPU panel shows overall and per-core CPU usage, load averages, CPU temperature when available, and system uptime.
- Memory panel shows RAM and swap usage, including used, available, and cached memory. It can also display mounted filesystems and their read/write activity.
- Network panel shows upload and download throughput for the selected network interface.
- Process panel lists running processes with details such as PID, user, CPU usage, and memory consumption. You can sort and filter the list, inspect processes, and send signals directly from the interface.
Because these panels combine information from several kernel interfaces into one live display, btop gives you a quick way to move from “the server is slow” to “which resource is actually causing the slowdown?”
How to Install btop on Linux
With that picture in mind, let’s install btop. It runs in the terminal and requires a terminal that can display its Unicode characters correctly.
On Ubuntu and Debian, btop is available through the distribution repositories. On Ubuntu, it is provided through the Universe repository, so you can install it directly with apt:
sudo apt update
sudo apt install -y btop
On Rocky Linux, AlmaLinux, and RHEL, btop is available through the EPEL (Extra Packages for Enterprise Linux) repository. Enable EPEL first, then install btop:
sudo dnf install -y epel-release
sudo dnf install -y btop
On other major distributions, btop is also available through the standard package manager:
# Fedora
sudo dnf install -y btop
# Arch Linux
sudo pacman -S btop
# openSUSE
sudo zypper install btop
# Alpine Linux
sudo apk add btop
# Gentoo
sudo emerge -a sys-apps/btop
Package versions can vary between distributions and may lag behind the latest upstream release, so check which version you installed:
btop --version
Example Output:
btop version: 1.3.0
The exact version depends on your Linux distribution and repository. You do not need the newest upstream release to follow the examples in this guide.
How to Use btop in Linux
Once btop is installed, start it from your terminal and start btop by running:
btop
You’ll see the four boxes described earlier, each with its own live graph.
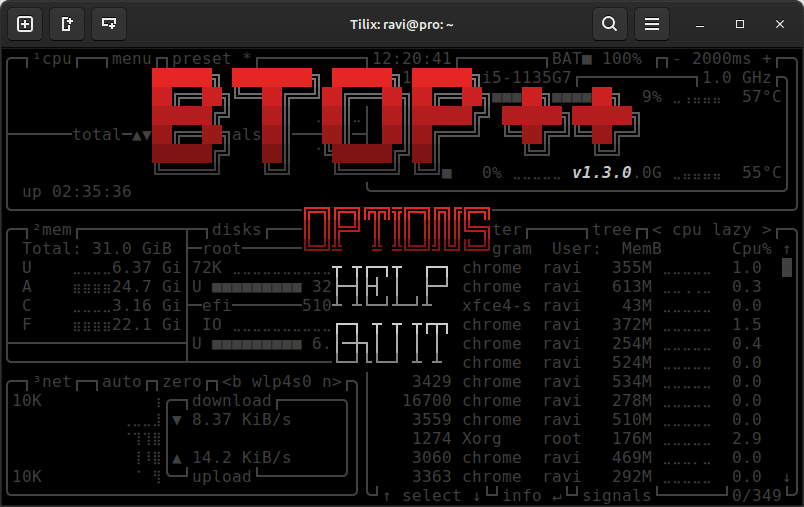
Press Esc to open btop’s main menu. From there, you can access:
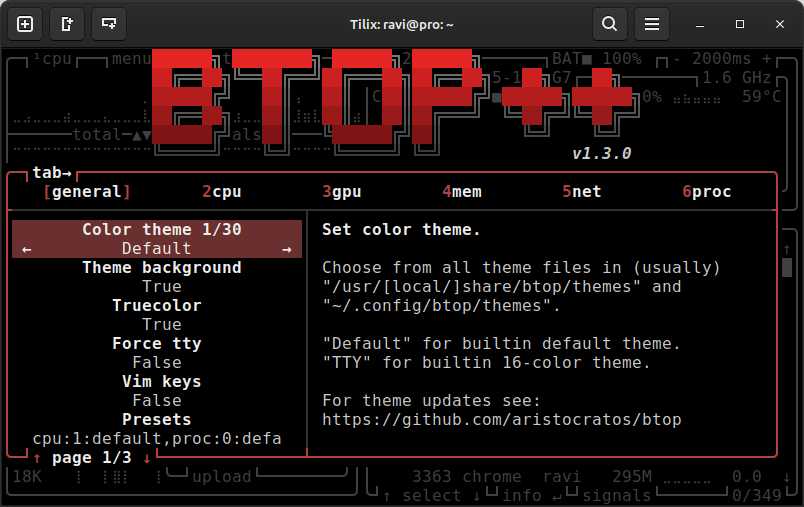
- Options opens the settings screen, where you can change the theme, refresh interval, and visible panels.
- Help displays the available keyboard shortcuts.
- Quit exits btop. You can also press q directly to quit without opening the menu.
If you’re using a different btop version, the menu may contain additional options, but these are the main entries you’ll use for everyday monitoring.
Practical Examples of Using btop
Now that btop is running, let’s use it to investigate problems you might actually be called in to fix.
Example 1: Find and Stop a Process Using Too Much CPU
Start with the CPU panel. If one core is consistently near 100% while the others are mostly idle, a single-threaded or CPU-bound workload may be responsible. If all cores are heavily loaded, the server may be dealing with broader CPU pressure.
Next, move to the process panel and sort the list by CPU or memory usage. You can change the sorting field using the arrow keys and quickly bring the busiest processes to the top.
To narrow the list, press f and type part of a process name, such as php. btop filters the process list as you type, making it easier to find the process you are looking for.
Press e to switch to tree mode. This makes parent-child relationships easier to see. For example, a busy php-fpm worker appears under its parent process, helping you identify the service responsible for the workload instead of treating individual workers as unrelated processes.
Select a process and press Enter to inspect additional information, including its command line and resource usage. If you need to stop the process, use the signal controls to send SIGTERM, which allows the process to exit cleanly. If it does not respond and you have confirmed that terminating it is safe, SIGKILL can be used as a last resort.
Whether you can signal a process depends on your permissions. A regular user can generally signal processes they own, while processes owned by another user, such as root, may require elevated privileges. If btop is running without the necessary permissions, a signal operation may fail.
Example 2: Watch Disk and Network Usage During a Backup
The first example focused on CPU, but many slowdowns happen during backups or large file transfers when disk I/O or network bandwidth becomes the bottleneck.
While a job such as rsync is running, watch the memory panel’s disk activity to see which mounted filesystem is experiencing read or write activity. At the same time, switch to the network panel and select the interface carrying the transfer.
The network panel displays one interface at a time. If btop starts on the loopback interface or a Docker bridge instead of the interface you need, use the interface controls to cycle through the available interfaces until you reach the correct one.
If the network graph remains close to the interface’s available bandwidth while rsync uses relatively little CPU, the network may be limiting the transfer. In that situation, you can deliberately throttle rsync with --bwlimit rather than allowing the backup to consume all available bandwidth:
rsync --bwlimit=5000 -av /data/ backup:/backup/
The value is specified in KiB/s, so 5000 limits the transfer to roughly 5 MiB/s.
Example 3: Customize btop Layouts with btop.conf
The default btop layout works well on a large terminal, but when you manage servers over SSH from a small laptop screen, you may want to display only the panels you actually need.
btop stores its configuration in btop.conf under your user’s configuration directory. You can inspect or change the settings from btop itself, or edit the file directly. If you edit the file manually, exit btop first so the running instance does not overwrite your changes when it closes.
On most Linux distributions, the configuration file is:
~/.config/btop/btop.conf
For example:
nano ~/.config/btop/btop.conf
If nano is not installed, use an editor that is available on the server, such as:
vi ~/.config/btop/btop.conf
You can customize settings such as the refresh interval, visible panels, process sorting, and preferred network interface. For example:
# ~/.config/btop/btop.conf
update_ms = 1500
shown_boxes = "cpu mem net proc"
proc_sorting = "cpu lazy"
net_iface = "enp1s0"
The exact interface name will differ between systems. Replace enp1s0 with the interface used by your server.
update_mscontrols how often btop refreshes its data, in milliseconds. A lower value updates the display more frequently but can slightly increase CPU usage.shown_boxescontrols which panels are displayed. The values are separated by spaces.proc_sortingsets the default process sorting method. cpu lazy sorts by CPU usage while reducing unnecessary movement when values change slightly.net_ifacespecifies the network interface displayed by the network panel.
Find your server’s interface with:
ip -br addr
For example:
lo               UNKNOWN        127.0.0.1/8
enp1s0            UP             192.168.122.248/24
If you want to launch btop remotely using SSH, allocate a pseudo-terminal with -t:
ssh -t [email protected] btop
The -t option allocates a terminal for the remote command, which is necessary for an interactive terminal application such as btop.
You can also start btop with a saved preset if you have configured presets in btop.conf.
htop fit.btop vs top, htop, and glances
With those examples done, here’s where btop fits among other system monitoring tools.
| Tool | Written in | Best for | Visualization | Process control |
|---|---|---|---|---|
| top | C | Quick checks and troubleshooting on virtually any Linux system | Basic text and meters | Kill and renice |
| htop | C | Interactive process management | Meters and bars | Kill, renice, tree view |
| glances | Python | Broad system monitoring with web and API options | Meters, charts, and statistics | Process actions |
| btop | C++ | Interactive overview of CPU, memory, disks, network, and processes | Live graphs and meters | Signals, filtering, sorting, tree view |
The choice depends on what you need. top remains the safest choice when you need a monitoring tool that is almost always available. htop provides a more interactive process-management experience, while glances is useful when you want a broader set of metrics and remote access through web or API interfaces.
btop is particularly useful when you want a visually rich terminal dashboard that combines CPU, memory, disk, network, and process information in one interface. It is not a replacement for specialized tools such as iostat or sar, but it is an excellent first stop when you need to quickly understand what a server is doing.
Pro Tips for Running btop on Production Servers
With btop configured, a few habits can keep it useful without allowing the monitoring tool itself to become a noticeable source of overhead.
btop consumes some CPU each time it refreshes the display, which can matter on small VPS instances or already CPU-constrained servers. Increasing update_ms to 3000 or higher reduces how frequently btop refreshes its data. You can also adjust the update interval while btop is running using the + and - keys.
Run btop as your normal user for everyday monitoring. Use sudo btop when you need elevated privileges, such as inspecting or signalling processes owned by another user. Avoid making btop SUID-root.
Giving a monitoring application permanent root privileges would allow users who can execute it to interact with processes and system resources beyond their normal permissions.
Fixing UTF-8 Problems over SSH
If btop refuses to start over SSH with an error about a missing UTF-8 locale, check the locale used by the remote session:
locale
If LANG and LC_CTYPE do not specify a UTF-8 locale, check which UTF-8 locales are installed:
locale -a | grep -i utf
Then select an available UTF-8 locale, for example:
export LANG=en_IN.UTF-8
export LC_ALL=en_IN.UTF-8
If the appropriate locale is not installed, generate or install it using the locale tools provided by your Linux distribution.
As a temporary workaround, if the terminal itself supports UTF-8, you can force btop to start with:
btop --utf-force
If the terminal cannot properly display btop’s Unicode characters, try:
btop --low-color
This reduces the use of color but does not replace Unicode characters. The -t option enables TTY mode and is useful in specific terminal environments, but it should not be presented as a general fix for UTF-8 or character-rendering problems.
Conclusion
You’ve installed btop, learned what its four panels show, and used it to identify a busy process, monitor disk and network activity, and customize the interface with btop.conf. You now have a practical tool to open when a Linux server suddenly feels slow.
If you want to go deeper into these metrics and learn when to move beyond btop to tools such as vmstat, iostat, and sar, our Linux Performance Monitoring Tools course on Pro Tecmint covers each tool through practical troubleshooting scenarios.
How do you use btop in your own environment? Do you run it as a normal user or with elevated privileges on production servers? Have you created custom layouts for different monitoring tasks? Share your setup or any btop output you find difficult to interpret in the comments.




Hi,
This is an incredibly useful guide!
I’ve been looking for a modern and feature-rich system monitor, and btop looks perfect.
Thanks a lot for the clear explanations and step-by-step instructions
What’s the difference between btop and bpytop, if any?
@Adrian,
btopandbpytopare almost identical in terms of functionality and UI, but the main difference is in their implementation. ️btop– Written in C++, making it faster and more efficient with lower resource usage.bpytop– Written in Python, which is slightly slower and more resource-intensive.Since
btopis the latest version and actively maintained, it’s the recommended choice.