CoreFreq is a CPU monitoring program intended for the Intel 64-bits processor and supports architectures such as Atom, Core2, Nehalem, SandyBridge and above, AMD Family 0F.
Its core is established on a kernel module which helps to retrieve internal performance counters from each CPU core, and works in relation with a daemon which gathers the data and a small console client links to the daemon and displays collected data.
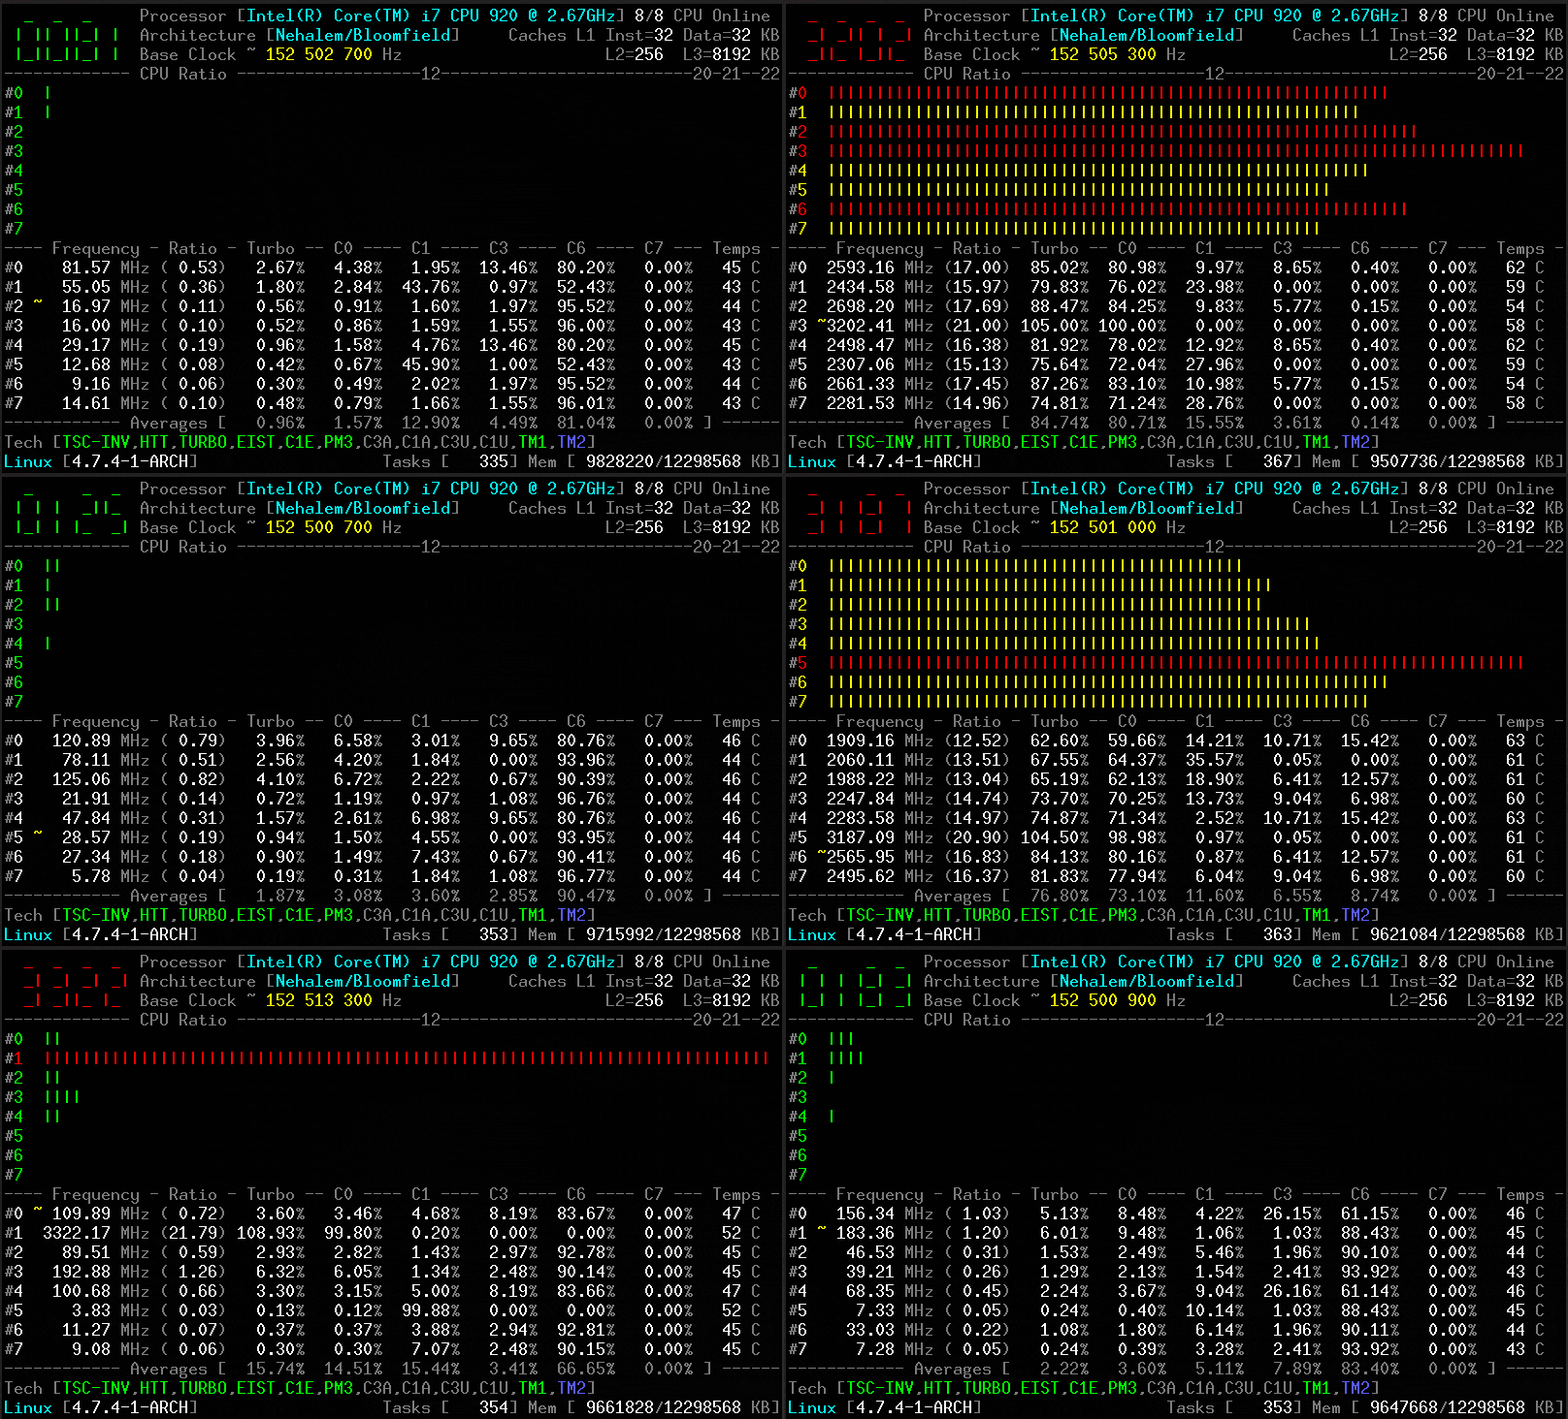
It offers a groundwork to recapture CPU data with a high degree of accuracy:
- Core frequencies & ratios; SpeedStep (EIST), Turbo Boost, Hyper-Threading (HTT) as well as Base Clock.
- Performance counters in conjunction with Time Stamp Counter (TSC), Unhalted Core Cycles (UCC), Unhalted Reference Cycles (URC).
- Number of instructions per cycle or second, IPS, IPC, or CPI.
- CPU C-States C0 C1 C3 C6 C7 – C1E – Auto/UnDemotion of C1 C3.
- DTS Temperature along with Tjunction Max, Thermal Monitoring TM1 TM2 state.
- Topology map including Caches for boostrap together with application CPU.
- Processor features, brand plus architecture strings.
Note: This tool is more useful and appropriate for expert Linux users and experienced system administrators, however, novice users can gradually learn how to purposefully use it.
How Does CoreFreq Works
It functions by invoking a Linux Kernel module which then uses:
- asm code to keep the readings of the performance counters as close as possible.
- per-CPU, effects slab data memory plus high-resolution timer.
- compliant with suspend / resume and CPU Hot-Plug.
- a shared memory to protect kernel from the user-space part of the program.
- atomic synchronization of threads to do away with mutexes and deadlock.
How to Install CoreFreq in Linux
To install CoreFreq, first you need to install the prerequisites (Development Tools) to compile and build the program from source.
$ sudo yum group install 'Development Tools'           [On CentOS/RHEL]
$ sudo dnf  group install 'Development Tools'          [On Fedora 22+ Versions]
# sudo apt-get install dkms git libpthread-stubs0-dev  [On Debian/Ubuntu]
Next clone the CoreFreq source code from the Github repository, move into the download folder and compile and build the program:
$ git clone https://github.com/cyring/CoreFreq.git
$ cd CoreFreq
$ make

Note: Arch Linux users can install corefreq-git from the AUR.
Now run the following commands to load the Linux kernel module from local directory followed by the daemon:
$ sudo insmod corefreqk.ko
$ sudo ./corefreqd
Then, start the client, as a user.
$ ./corefreq-cli

From the interface above, you can use shortcut keys:
F2to display a usage menu as seen at the top section of the screen.RightandLeftarrows to move over the menu tabs.UpandDownarrows to select a menu item, then click [Enter].F4will close the program.hwill open a quick reference.
To view all usage options, type the command below:
$ ./corefreq-cli -h
CoreFreq.  Copyright (C) 2015-2017 CYRIL INGENIERIE

usage:	corefreq-cli [-option <arguments>]
	-t	Show Top (default)
	-d	Show Dashboard
		  arguments: <left> <top> <marginWidth> <marginHeight>
	-c	Monitor Counters
	-i	Monitor Instructions
	-s	Print System Information
	-M	Print Memory Controller
	-m	Print Topology
	-u	Print CPUID
	-k	Print Kernel
	-h	Print out this message

Exit status:
0	if OK,
1	if problems,
>1	if serious trouble.

Report bugs to labs[at]cyring.fr
To print info about the kernel, run:
$ ./corefreq-cli -k
Print CPU identification details:
$ ./corefreq-cli -u
You can as well monitor CPU instructions in real-time:
$ ./corefreq-cli -i
Enable tracing of counters as below:
$ ./corefreq-cli -c
For more information and usage, visit the CoreFreq Github repository: https://github.com/cyring/CoreFreq
In this article, we reviewed a powerful CPU monitoring tool, which may be more useful to Linux experts or experienced system administrators as compared to novice users.
Share your thoughts about this command tool or any related ideas with us via the feedback form below.

Can we monitor threads’ status graphically? for about one month?
corefreq-cli -joutputs values in JSON
Please contacts me through GitHub issues for further details
https://github.com/cyring/CoreFreq/issues
Unfortunately after the last command sudo ./corefreqd the terminal displays:
Nothing else, no prompt, no GUI, no result, just waits, until you exit the terminal.
System Specs:
Linux Mint 18.1 Serena
Kernel: x86_64 Linux 4.10.0-22-generic
Uptime: 3d 17h 24m
Shell: bash 4.3.48
Resolution: 3200×900
DE: Mate
WM: Compiz
Theme: Crux
CPU: Intel Core i5-6600K CPU @ 3.9GHz
GPU: Gallium 0.4 on AMD PITCAIRN (DRM 2.49.0 / 4.10.0-22-generic, LLVM 4.0.0)
RAM: 5939MiB / 7776MiB
@Scott
To use it, run this command on the terminal:
$./corefreq-cli
Hello Scott,
Just leave sudo corefreqd running, it is the daemon, next run corefreq-cli in another terminal to start the UI
Regards
CyrIng
Thanks for that. I wish that explanation were that clear and precise in the beginning. Coders appreciate people who are accurate and pay attention to detail.
Very nice, I just wonder how can I measure in real time the Vcore and Temps, since I have an AMD 8320e Cpu OC to @4.4 GHz, my Asus motherboard can show me everything from the “Asus AI Suite app” in Windows.
But in Linux is kind of hard for me to get accurate measurements from the voltages and temps. Anyway thanks for the article.
@Daest
Many thanks, hope you enjoyed it. We’ll do a little research on this topic(measure in real time the Vcore and CPU Temps) and write a complete article soon as soon as possible as you have requested.
Check out these useful programs for the above purpose for Linux:
1.Psensor – A Graphical Hardware Temperature Monitoring Tool for Linux
2. Conky – The Ultimate X Based System Monitor Application
You can the command below to watch CPU temperatures in real-time:
watch sensors