Atop is a full screen performance monitor that can report the activity of all processes, even the ones that have been completed. Atop also allows you to keep daily log of system activities. The same can be used for different purposes, including analysis, debugging, pinpointing the cause of a system overload and others.
Atop Features
- Check the overall resource consumption by all processes
- Check how much of the available resources have been utilized
- Logging of resource utilization
- Check resource consumption by individual threads
- Monitor process activity per user or per program
- Monitor network activity per process
The latest version of Atop is 2.1 and includes following features
- New logging mechanism
- New key flags
- New Fields (counters)
- Bug fixes
- Configurable colors
Installing Atop Monitoring Tool on Linux
1. In this article, I will show you how to install and configure atop on Linux systems like RHEL/CentOS/Fedora and Debian/Ubuntu based derivatives, so that you can easily monitor your system processes.
On RHEL/CentOS/Fedora
First you will need to enable epel repository under RHEL/CentOS/ systems, in order to install atop monitoring tool.
After you’ve enabled epel repository, you can simple use the yum package manager to install atop package as shown below.
# yum install atop
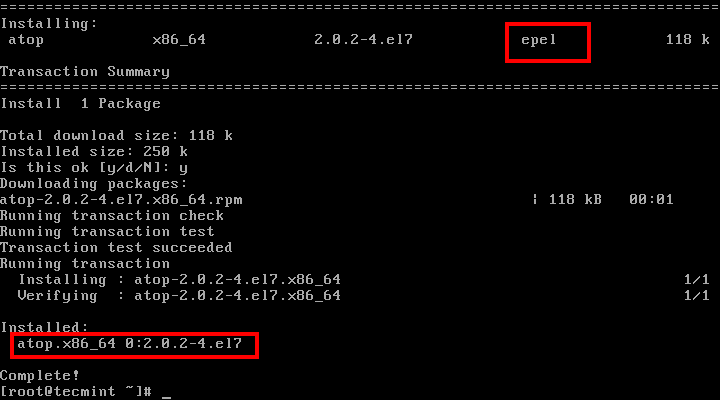
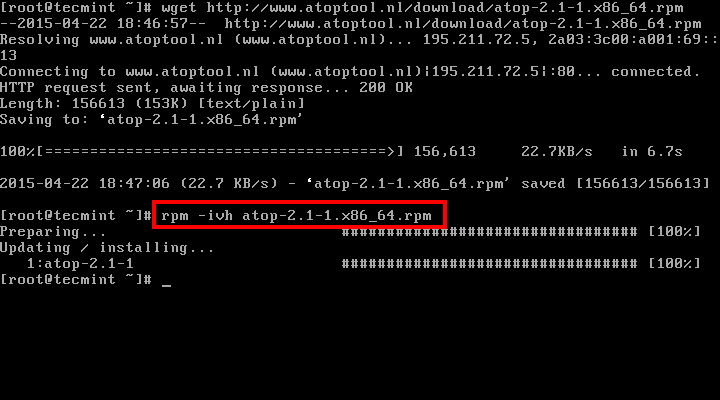
Alternatively, you may download direct atop rpm packages using following wget command and continue with the installation of atop, with the following command.
------------------ For 32-bit Systems ------------------
# wget http://www.atoptool.nl/download/atop-2.1-1.i586.rpm
# rpm -ivh atop-2.1-1.i586.rpm

------------------ For 64-bit Systems ------------------
# wget http://www.atoptool.nl/download/atop-2.1-1.x86_64.rpm
# rpm -ivh atop-2.1-1.x86_64.rpm
On Debian/Ubuntu
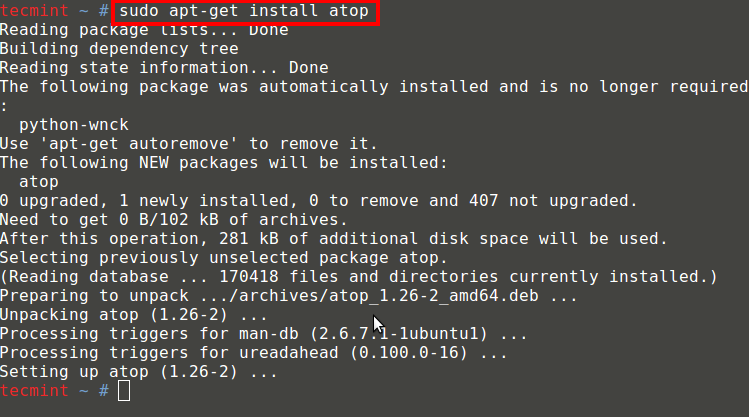
Under Debian based systems, atop can be installed from the default repositories using apt-get command.
$ sudo apt-get install atop
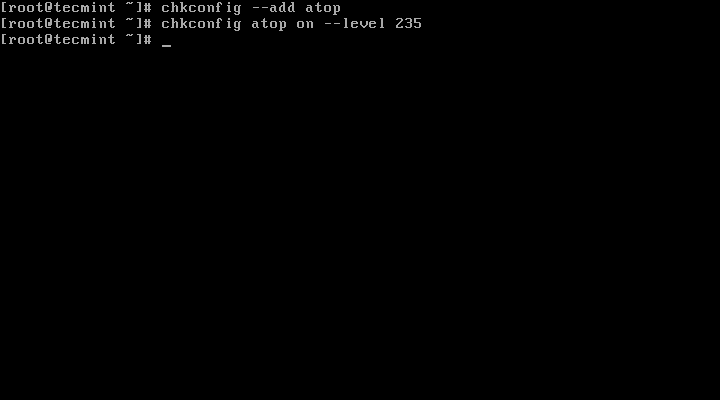
2. After installing atop, make sure atop will start upon system start up, run the following commands:
------------------ Under RedHat based systems ------------------
# chkconfig --add atop
# chkconfig atop on --level 235
$ sudo update-rc.d atop defaults [Under Debian based systems]

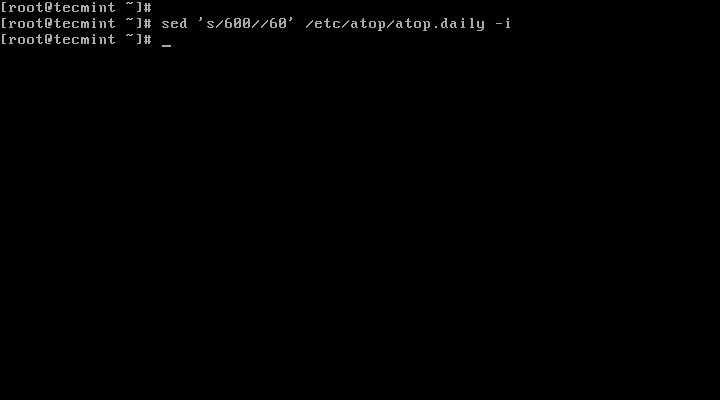
3. By default atop will log all the activity on every 600 seconds. As this might not be that useful, I will change atop’s configuration, so all the activities will be logged in interval of 60 seconds. For that purpose run the following command:
# sed 's/600/60/' /etc/atop/atop.daily -i                [Under RedHat based systems]
$ sudo sed 's/600/60/' /etc/default/atop -i              [Under Debian based systems]
Now that you have atop installed and configured, the next logical question is “How do I use it?”. Actually there are few ways for that:
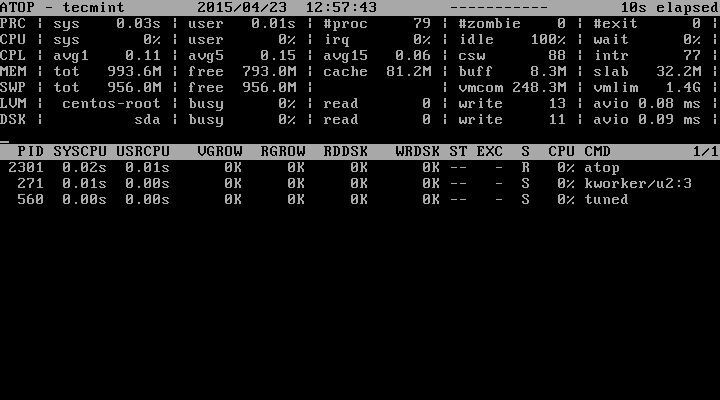
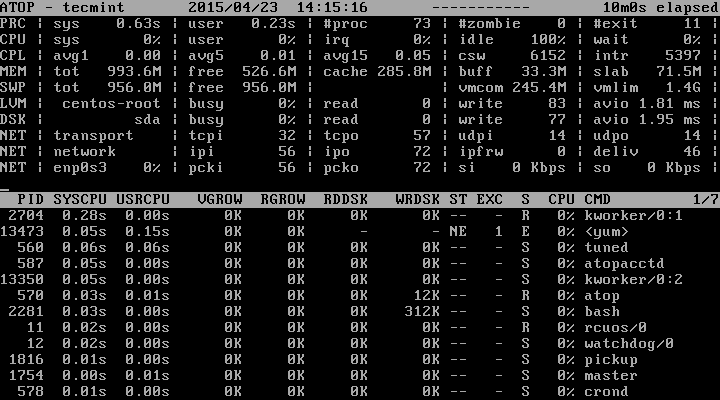
4. If you just run atop in terminal you will have top like interface, which will update every 10 seconds.
# atop
You should see a screen similar to this one:
You can use different keys within atop to sort the information by different criteria. Here are some examples:
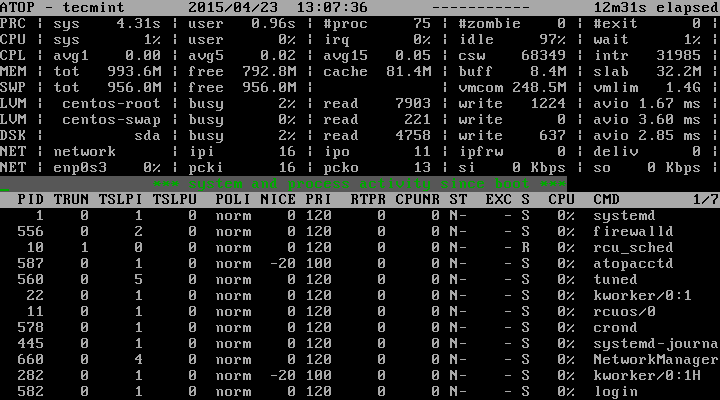
5. Scheduling information – “s” key – shows scheduling information for the main thread of each process. Also indicates how many processes are in state “running”:
# atop -s
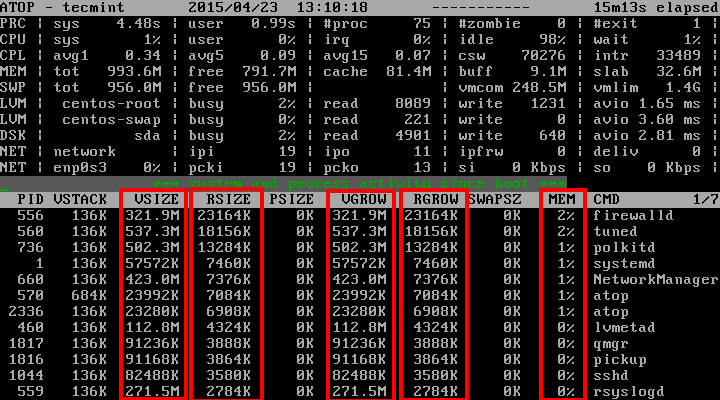
6. Memory consumption – “m” key – shows memory related information about all running processes The VSIZE column indicates the total virtual memory and the RSIZE shows the resident size used per process.
The VGROW and RGROW indicate the growth during the last interval. The MEM column indicates the resident memory usage by the process.
# atop -m
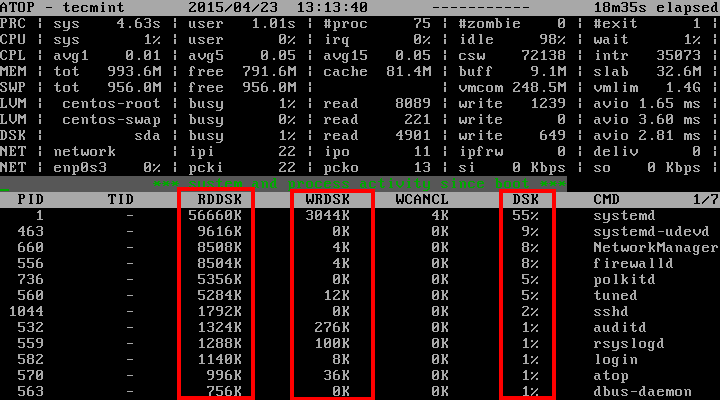
7. Show disk utilization – “d” key – shows the disks activity on a system level (LVM and DSK columns). Disk activity is shown as amount of data that is being transferred by reads/writes (RDDSK/WRDSK columns).
# atop -d
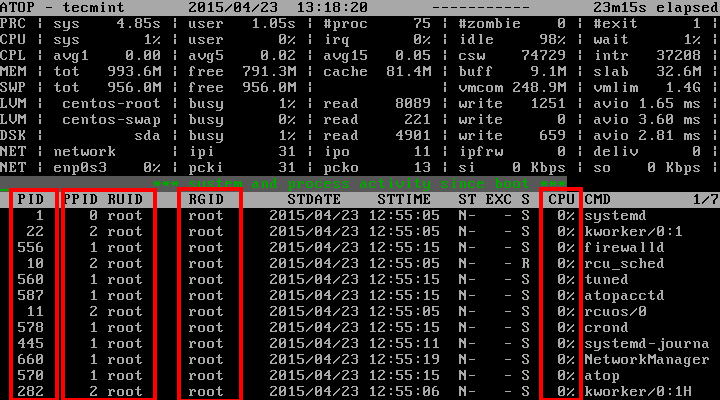
8. Show variable information – “v” key – this option displays provides more specific data about the running processes like uid, pid, gid, cpu usage, etc:
# atop -v
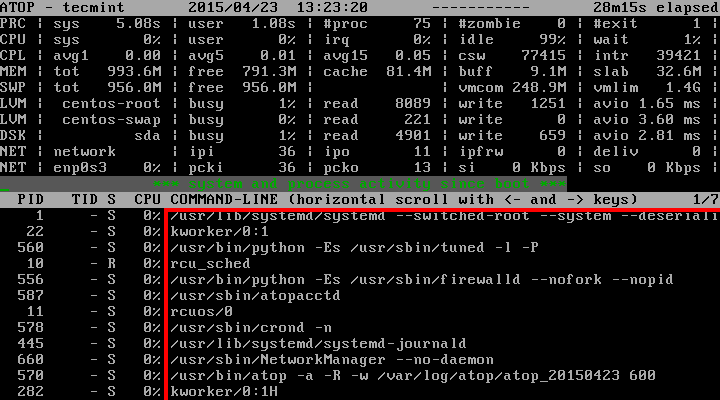
9. Show command of processes – “c” key:
# atop -c
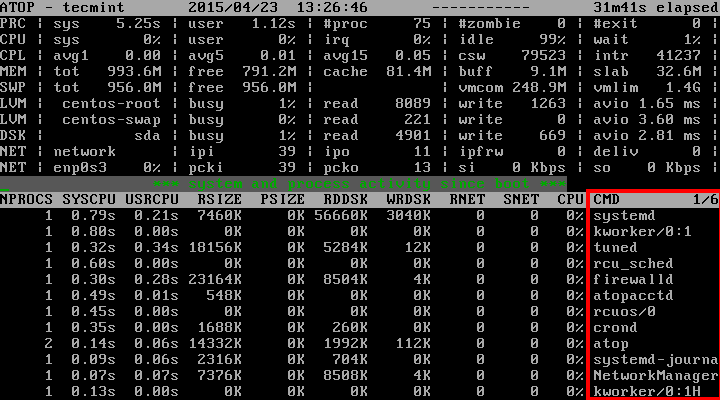
10. Cumulative per program – “p” key – the information shown in this window is accumulated per program. The most right column shows which programs are active (during the intervals) and the most left column shows how many process they have spawned.
# atop -p
11. Cumulative per user – “u” key – this screen shows which users were/are active during the last interval and indicates how many processes each user runs/ran.
# atop -u
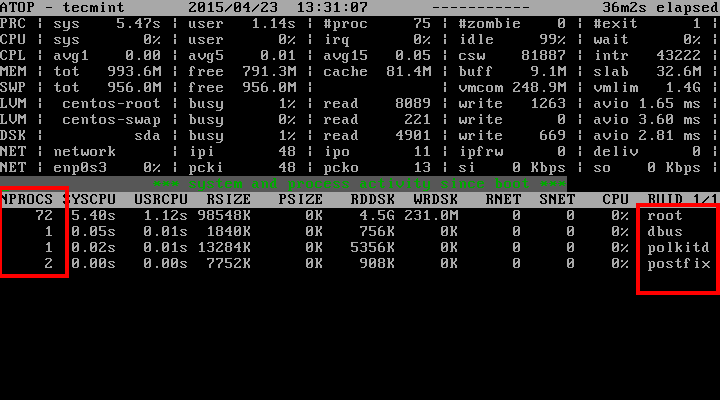
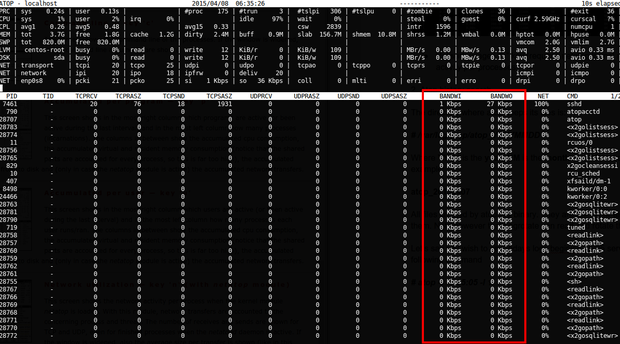
12. Network usage – “n” key (requires netatop kernel module) shows the network activity per processes.
To install and active netatop kernel module, you need to have following dependency packages installed on your system from the distributor’s repository.
# yum install kernel-devel zlib-devel                [Under RedHat based systems]
$ sudo apt-get install zlib1g-dev                    [Under Debian based systems]
Next download the netatop tarball and build the module and daemon.
# wget http://www.atoptool.nl/download/netatop-0.3.tar.gz
# tar -xvf netatop-0.3.tar.gz
# cd netatop-0.3
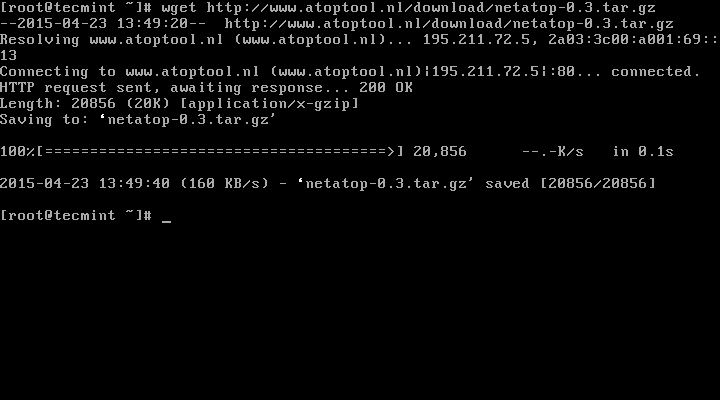
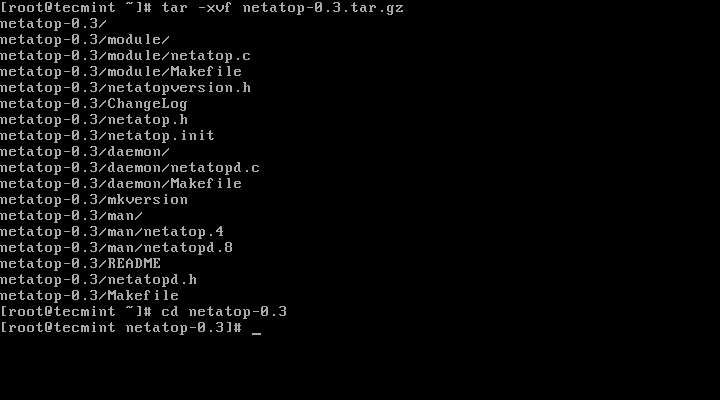
Go to the ‘netatop-0.3‘ directory and run the following commands to install and build the module.
# make
# make install
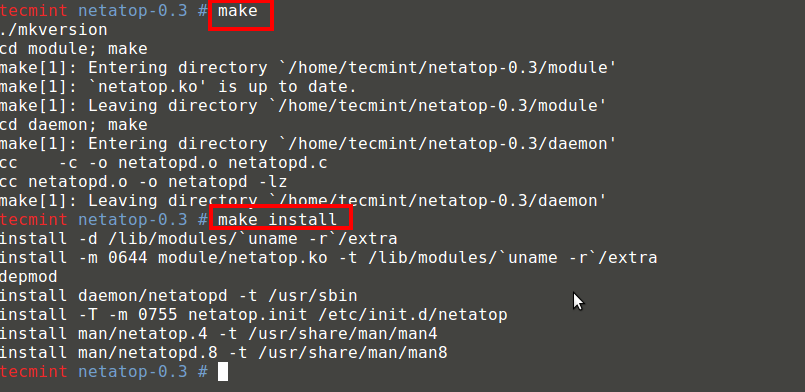
After netatop module installed successfully, load the module and start the daemon.
# service netatop start
OR
$ sudo service netatop start
If you want to load the module automatically after boot, run one of the following commands depending on the distribution.
# chkconfig --add netatop                [Under RedHat based systems]
$ sudo update-rc.d netatop defaults      [Under Debian based systems]
Now check network usage using “n” key.
# atop -n
13. The directory where atop keeps its history files.
# /var/log/atop/atop_YYYYMMDD
Where YYYY is the year, MM is the month and DD current day of the month. For example:
atop_20150423
All files created by atop are binary. They are not log or text files and only atop can read them. Note however that Logrotate can read and rotate those files.
Let’s say you wish to see todays logs beginning 05:05 server time. Simply run the following command.
# atop -r -b 05:05 -l 1
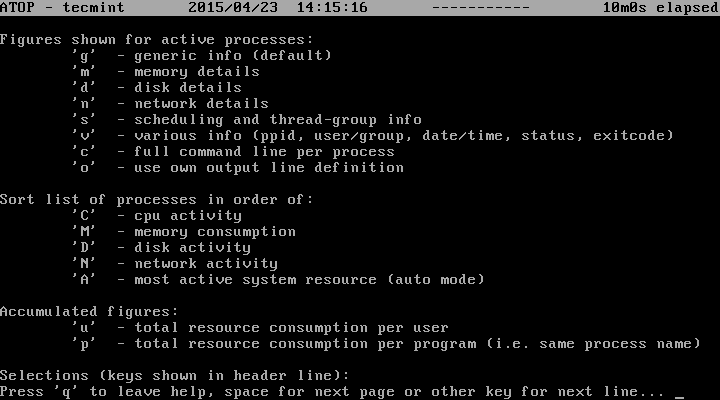
The atop options are quite a lot and you may wish to see the help menu. For that purpose in the atop window simply use the “?” character to see list of arguments that atop can use. Here is list of most frequently used options:
I hope you find my article useful and help you narrow down or prevent issues with your Linux system. In case you have any questions or would like to receive clarification for the usage of atop, please post a comment in the comment section below.
Read Also: 20 Command Line Tools to Monitor Linux Performance

On Ubuntu 18.04 the following changes/additions where necessary:
“Config” file is now in /usr/share/atop/atop.daily.
@Kelems,
Thanks for sharing with us, hope it will help Ubuntu 18.04 users..
Hey how to pass number of samples to atop
make
./mkversion
cd module; make
make[1]: Entering directory `/root/netatop-0.3/module’
echo start the make
start the make
make -C /lib/modules/2.6.32-042stab120.11/build M=/root/netatop-0.3/module modules
make: Entering an unknown directory
make: *** /lib/modules/2.6.32-042stab120.11/build: No such file or directory. Stop.
make: Leaving an unknown directory
make[1]: *** [netatop.ko] Error 2
make[1]: Leaving directory `/root/netatop-0.3/module’
make: *** [all] Error 2
@Bruno,
Why you compiling from source atop? when you can easily install from default repositories using your system package manager APT or YUM.
Concerning: /lib/modules/2.6.32-042stab120.11/build: No such file or directory
I just got the same error on Centos 7. Apparently “uname -r” output mismatches the name of the kernel files the netatop needs (some minor version number differences).
Here’s the solution:
No per process network counter available, is coming when i run atopsar -N after installing netatop following your steps above.
Hi, atop is really a good software to monitor system processes. first when i install this. I got error again after trying two times i got the same error. Then i discussed with my mentor about this. he resolved the issue.Thanks for sharing this blog post.
hi … i’m a linux newbie and am using SLES 11. How would i go about getting atop installed on SLES … it doesn’t appear to be mentioned above
@Jamie,
Yeah, you can install atop on Suse Linux with the help of following commands.
Hi everyone,
I would like to see log in a period time: atop -r -b 15:45 -e 16:20
But i only see a log right after the beginning time (15:45). How i can see the next log.
Thank you so much.
Hello maqsimum,
If you have used the epel repository to install the package, the configuration can be found in:
/etc/sysconfgi/atop
You can use this command:
sed ‘s/600/60/’ /etc/sysconfig/atop -i
When I run the command to modify atop from 600 seconds to 60, it gives an error:
# sed ‘s/600/60/’ /etc/atop/atop.daily -i
sed: can’t read /etc/atop/atop.daily: No such file or directory