

IPTraf-ng is a console-based Linux network statistics monitoring program that shows information about IP traffic, which includes information such as:
- Current TCP connections
- UDP, ICMP, OSPF, and other types of IP packets
- Packet and byte counts on TCP connections
- IP, TCP, UDP, ICMP, non-IP, and other packet and byte counts
- TCP/UDP counts by ports
- Packet counts by packet sizes
- Packet and byte counts by IP address
- Interface activity
- Flag statuses on TCP packets
- LAN station statistics
The IPTraf-ng utility can be used to find out the type of traffic on your network, and what kind of service is the most heavily used on what systems, among others.
In this article, you will learn how to install and use the IPTraf-ng network statistics utility in Linux systems.
Installing IPTraf-ng in Linux
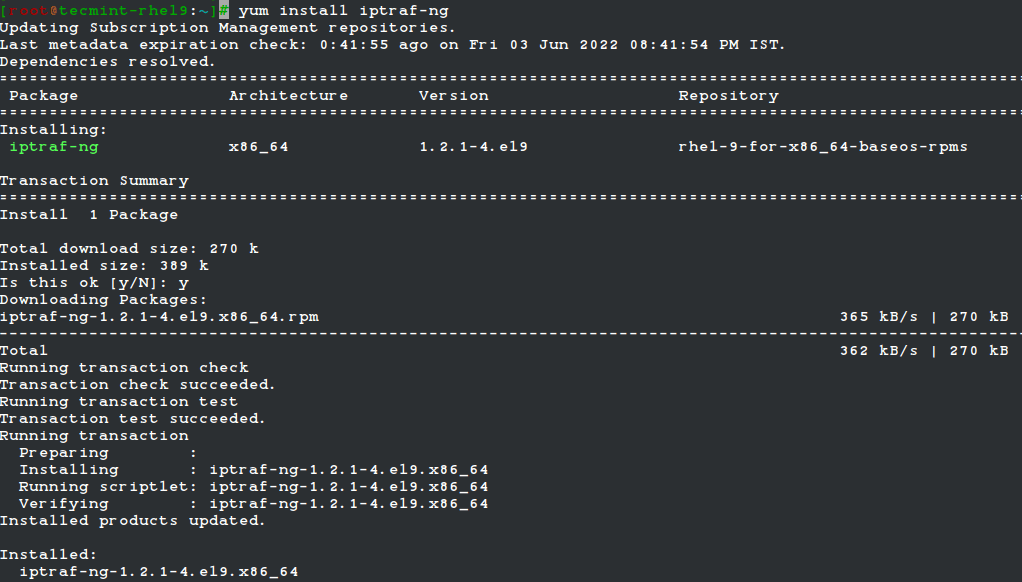
IPTraf-ng is part of the Linux distribution and can be installed on RHEL-based distributions such as CentOS Stream, Fedora, Rocky Linux, and AlmaLinux using the following yum command from the terminal.
# yum install iptraf-ng
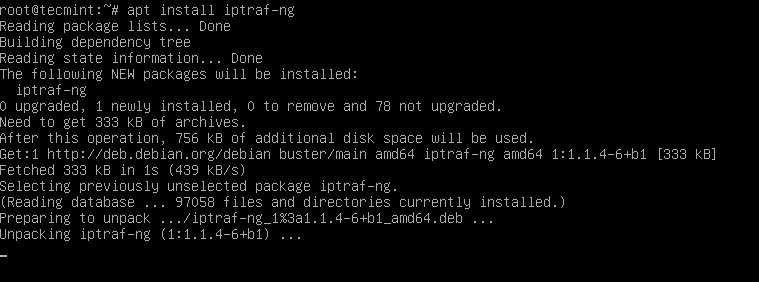
Under Debian-based distributions, iptraf-ng can be installed using Ubuntu Software Center or apt package manager as shown.
$ sudo apt install iptraf-ng
Usage of IPTraf-ng in Linux
Once iptraf-ng is installed, run the following command from the terminal to launch an ascii-based menu interface that will allow you to view current IP traffic monitoring, General interface statistics, Detailed interface statistics, Statistical breakdowns, LAN station monitors, Filters, and also provide some configure options where you can configure as per your need.
# iptraf-ng
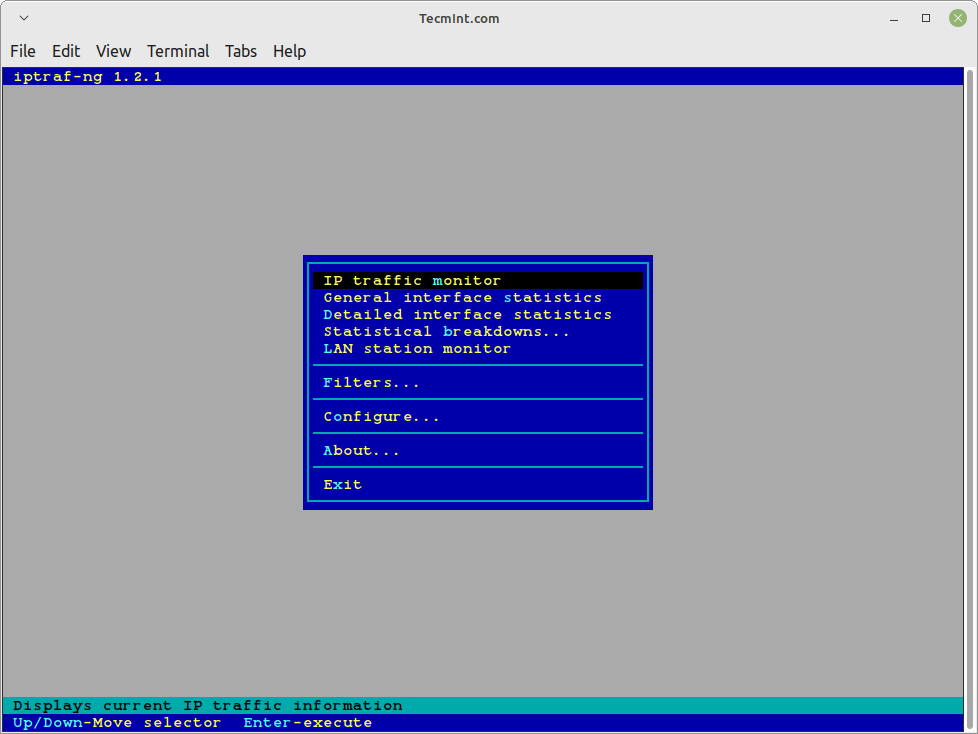
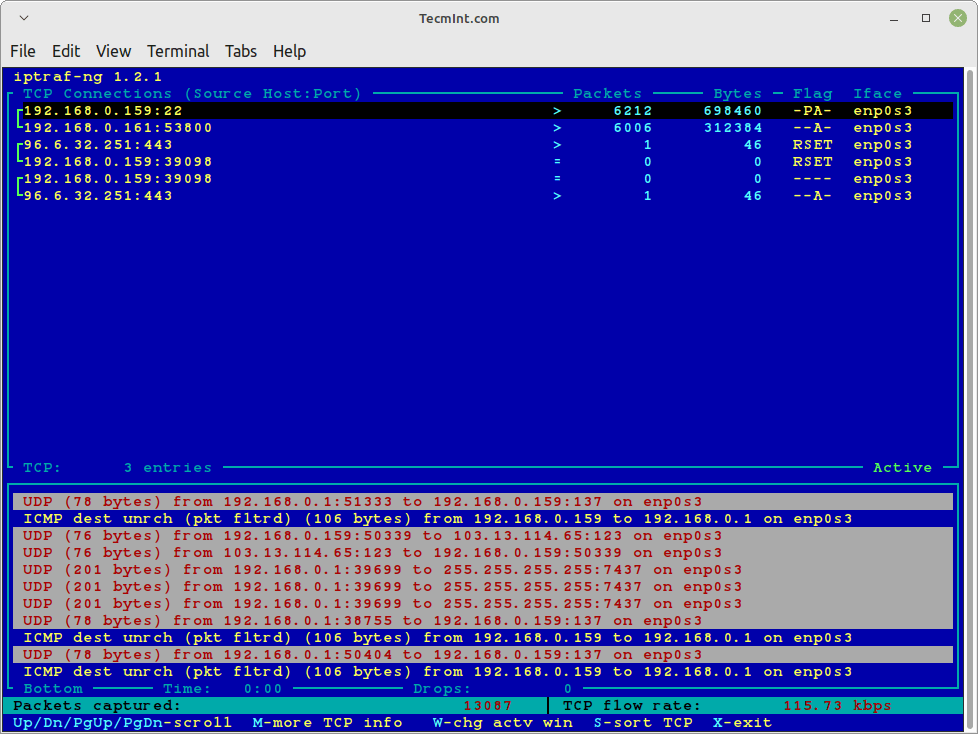
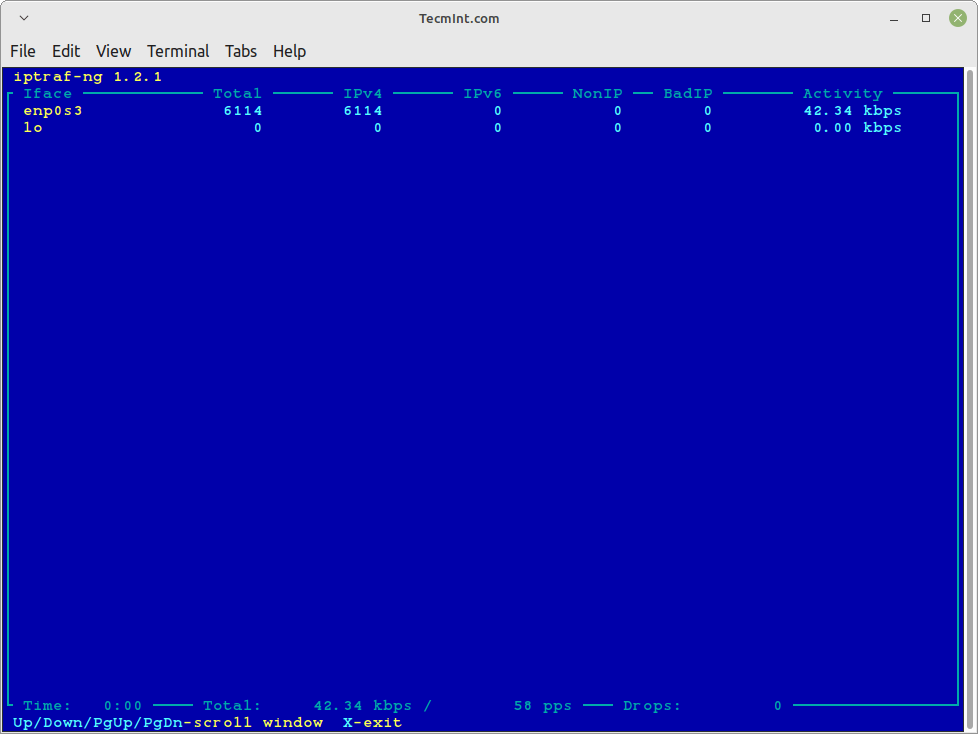
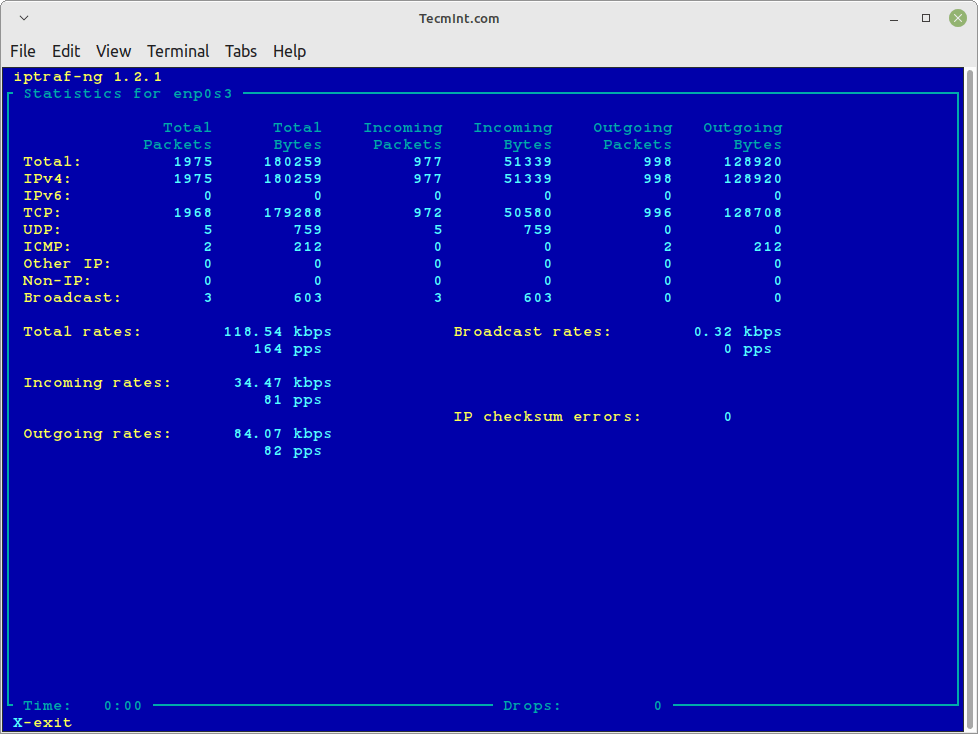
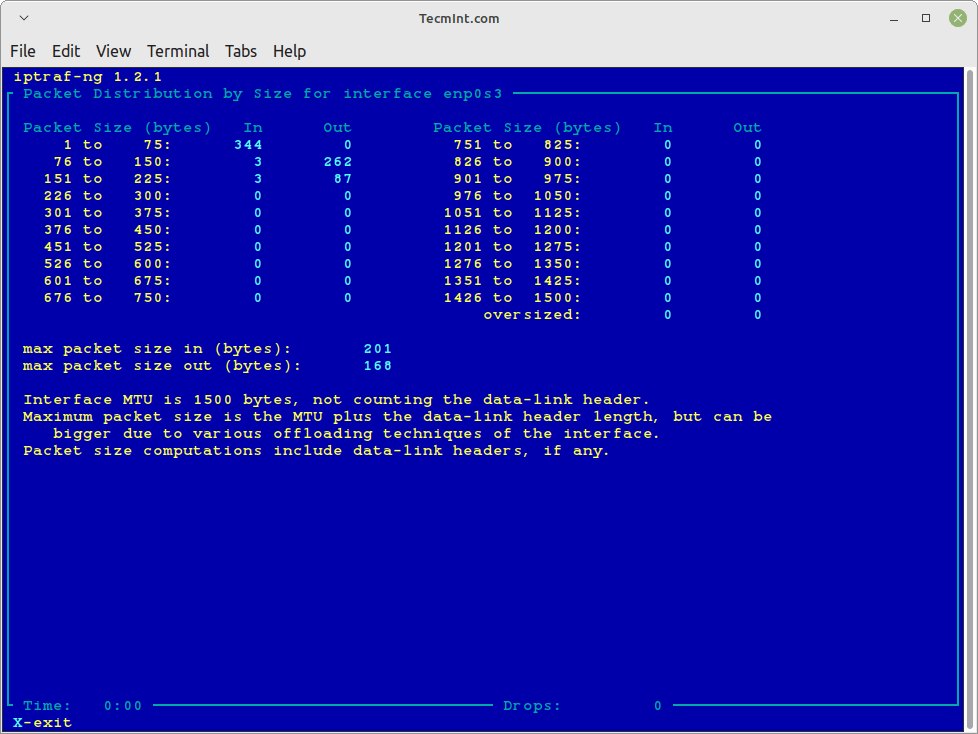
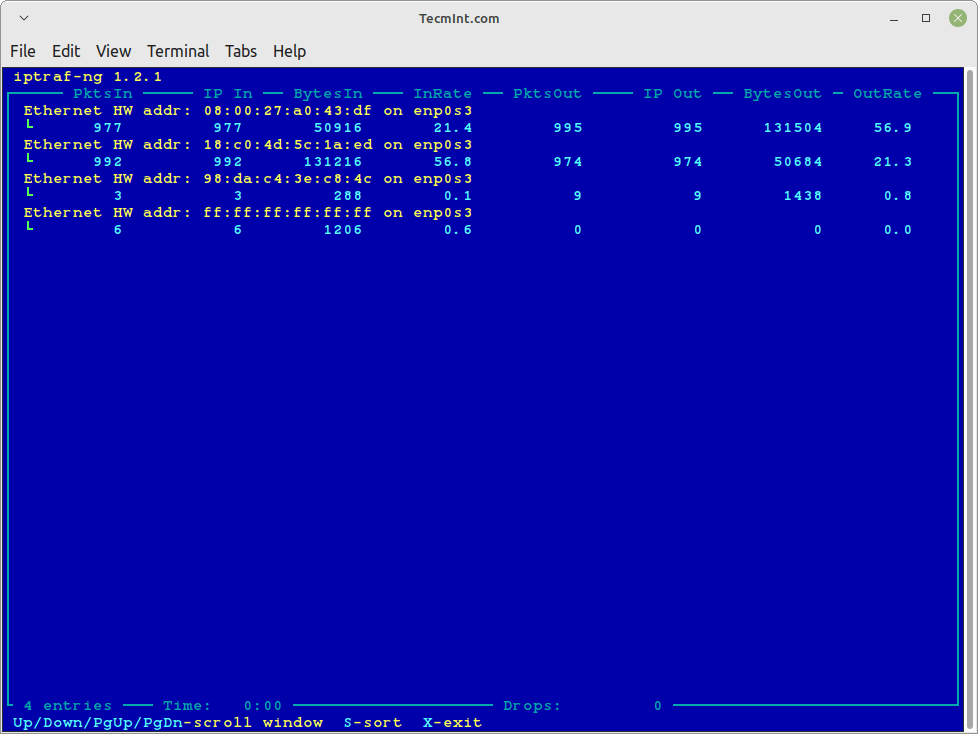
The iptraf interactive screen displays a menu system with different options to choose from. Here are some screenshots that show real-time IP traffic counts and interface statistics etc.
Check IP Traffic in Linux
General Interface Statistics
Detailed Interface Statistics
Statistical Breakdowns
LAN Station Monitor
Configure
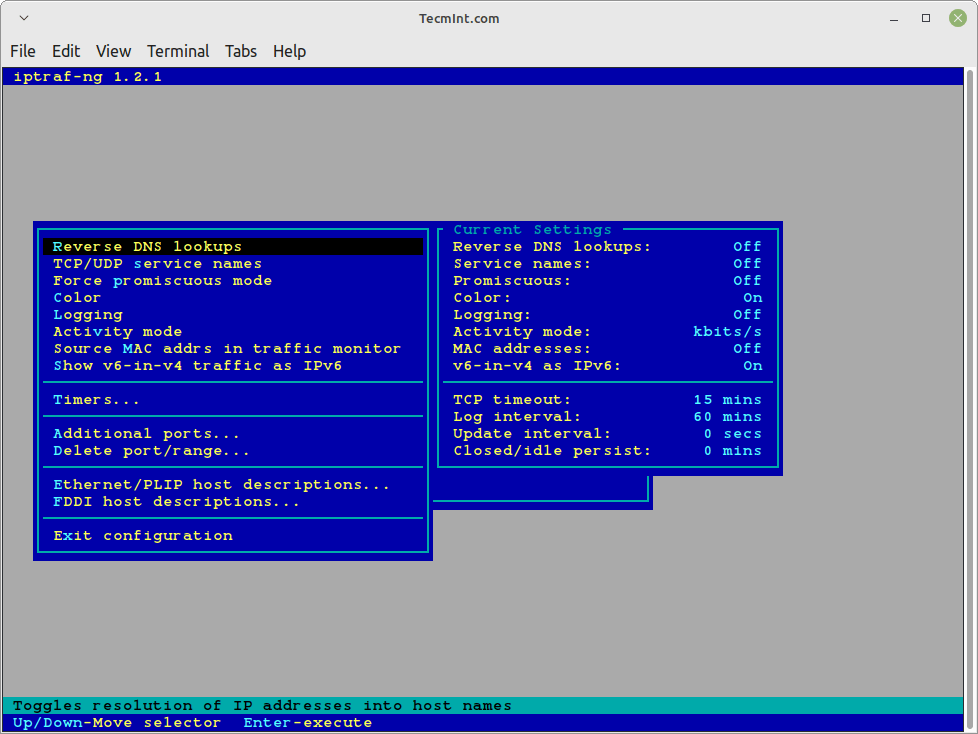
IPTraf Options
Using “iptraf -i” will immediately start the IP traffic monitor on a particular interface. For example, the following command will start the IP traffic on interface eth0.
This is the primary interface card that is attached to your system. Else you can also monitor all your network interface traffic using the argument as “iptraf -i all“.
# iptraf-ng -i eth0
Or
# iptraf-ng -i all
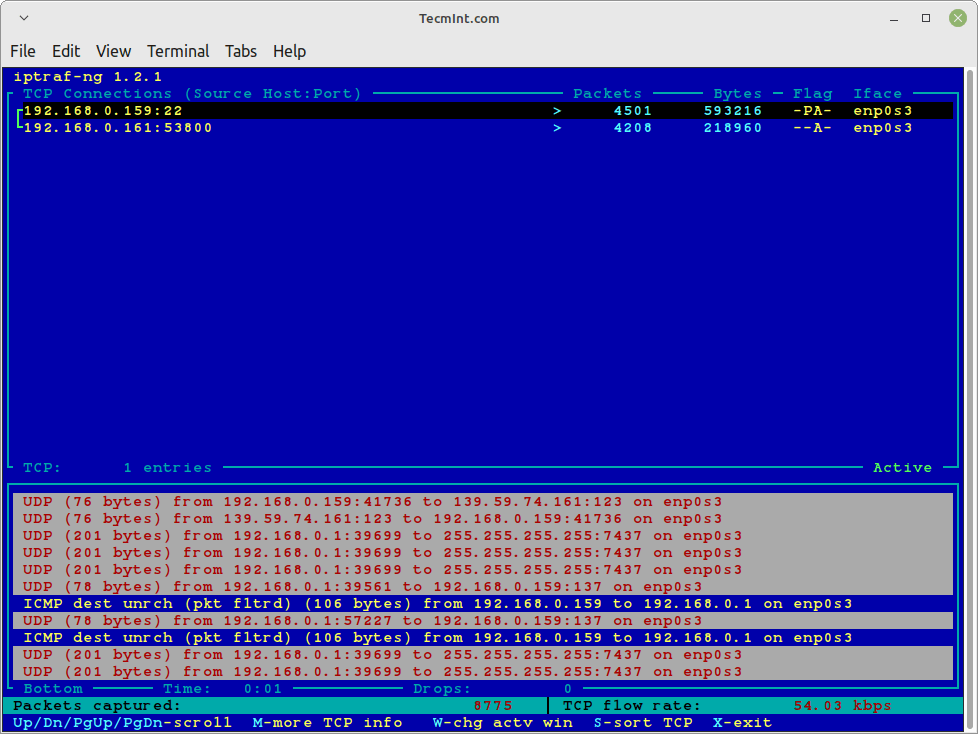
Similarly, you can also monitor TCP/UDP traffic on a specific interface, using the following command.
# iptraf-ng -s eth0
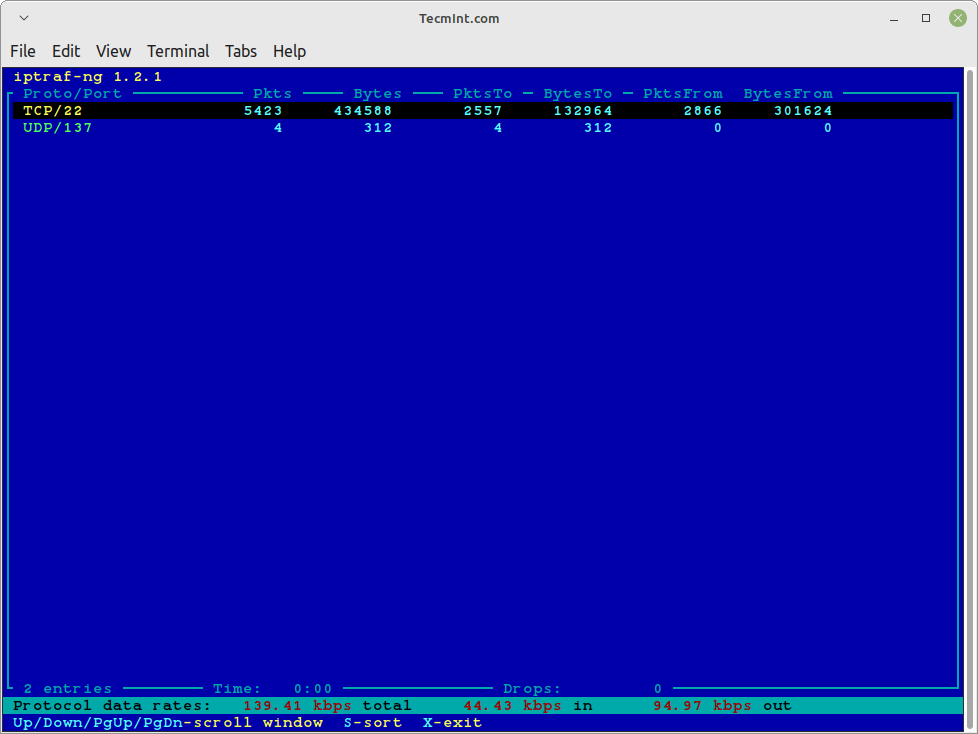
If you want to know more options and how to use them, check iptraf-ng ‘man page‘ or use the command as ‘iptraf-ng -help‘ for more parameters. For more information visit the official project page.

No offense meant, but I seem not to appreciate IPTraf a lot. I tend to find the information it displays not very “helpful”. I know Wireshark is too detailed and Etherape consumes lots of CPU resources but I think ifTop does a better job. Maybe it’s just the type of info I look at when monitoring the LAN, who knows. I like the IPTraf interface though.
Nice Read, do you know an application somehow similar to iptraf that can be used to configure other network related configurations like firewall? Routing?
Hi! Do you know why the synthetic NICs from Hyper-V doesn’t show to IPtraf?
Normally the NICs shows up like seth0.
Thanks!
Fabio