The CPU or GPU temperature depends entirely on the usage of running programs or applications. Sensitive computer components such as CPUs have a finite lifespan and running them at a temperature that exceeds a certain limit (or at higher temperatures generally) can shorten it. Besides, it can also cause thermal throttling especially when the fan is not providing adequate cooling.
Recommend Read: 10 Useful Commands to Collect System and Hardware Information in Linux
So it is important to monitor your system’s CPU temperature to avoid damaging it as a result of overheating. In this article, we will share some useful command-line tools to help you keep a close eye on the temperature of your CPU and GPU.
1. Glances
Glances is a cross-platform, advanced and popular real-time system monitoring tool that uses the psutil library to gather information from various system resources.
It can display information from sensors using the psutil and/or hddtemp tools. One of its intriguing features is the webserver mode which allows you to access it via a web browser to remotely monitor your Linux server.
There are various methods to install Glances on your system, but the preferred way of installing glances is using an auto-install script, which will install the latest production-ready version.
To install Glances on your system, use curl or wget command as shown.
# curl -L https://bit.ly/glances | /bin/bash
OR
# wget -O- https://bit.ly/glances | /bin/bash
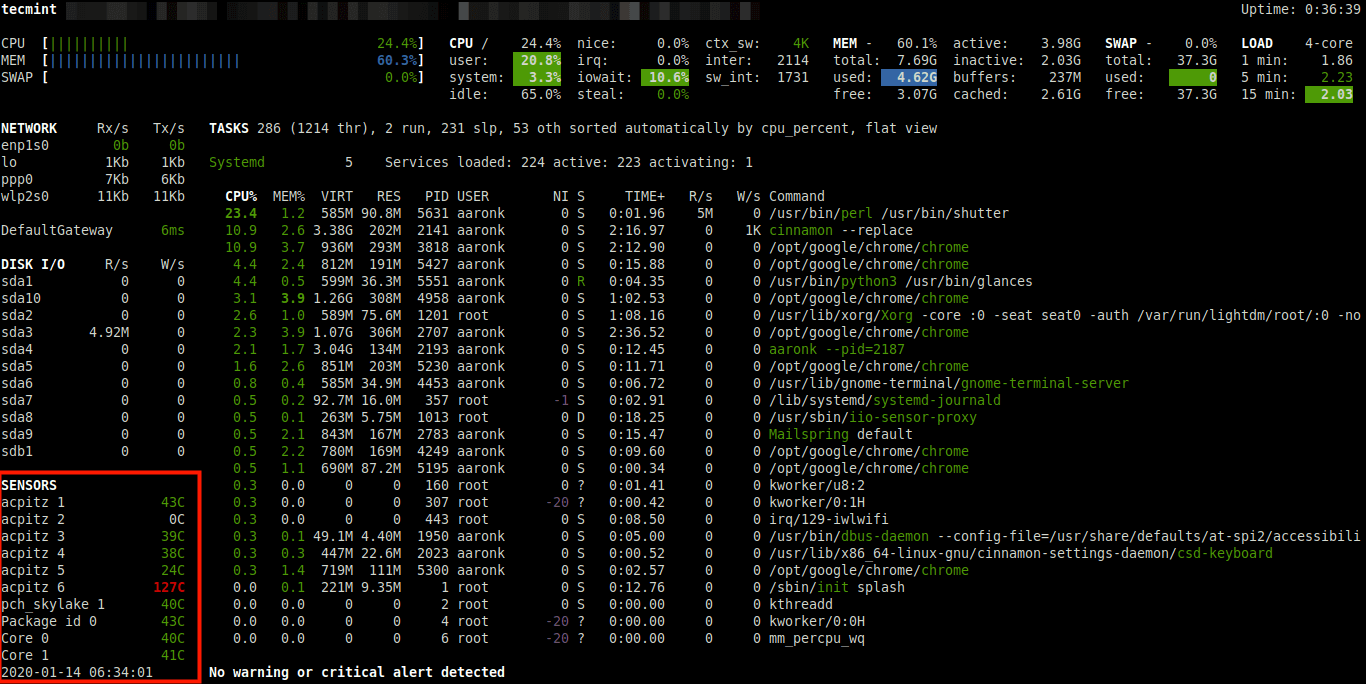
Once you have installed it, start Glances and press f key to view sensors information.
# glances
2. Sensors
Sensors is a simple command-line utility that displays the current readings of all sensor chips including the CPU. It comes pre-installed some Linux distributions such as Ubuntu by default, otherwise install it as shown.
$ sudo apt-get install lm-sensors
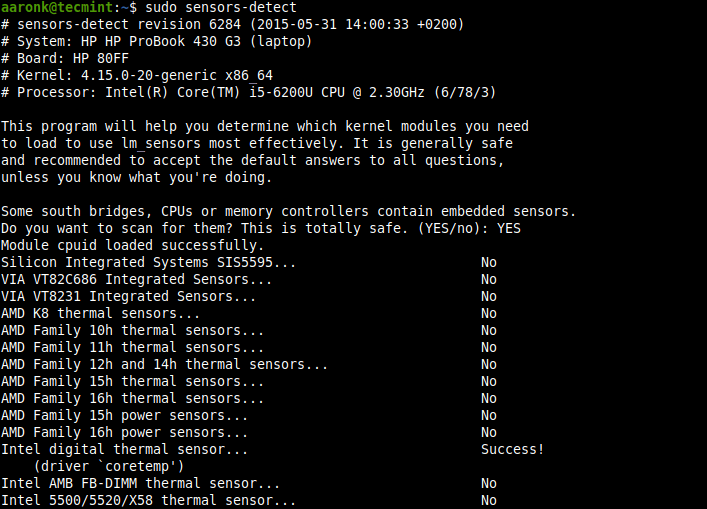
Then you can run the following command to detect all sensors on your system.
$ sudo sensors-detect
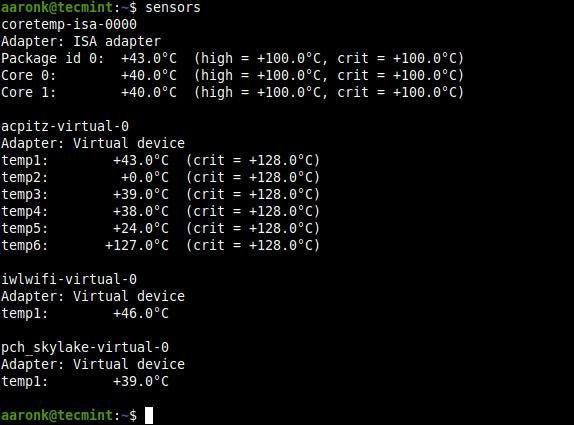
Once detected, you can run the following command to check CPU temperature, GPU temperature, fan speed, voltage, etc.
$ sensors
Recommended Read: Psensor – A Graphical Hardware Temperature Monitoring Tool for Linux
3. Hardinfo
Hardinfo is a lightweight system profiler and benchmark tool designed for hardware analysis and report generation. It features comprehensive reports on system hardware and allows for the generation of HTML reports on your system’s hardware.
To install the hardinfo package on your Ubuntu Linux system, run the following command.
$ sudo apt install hardinfo
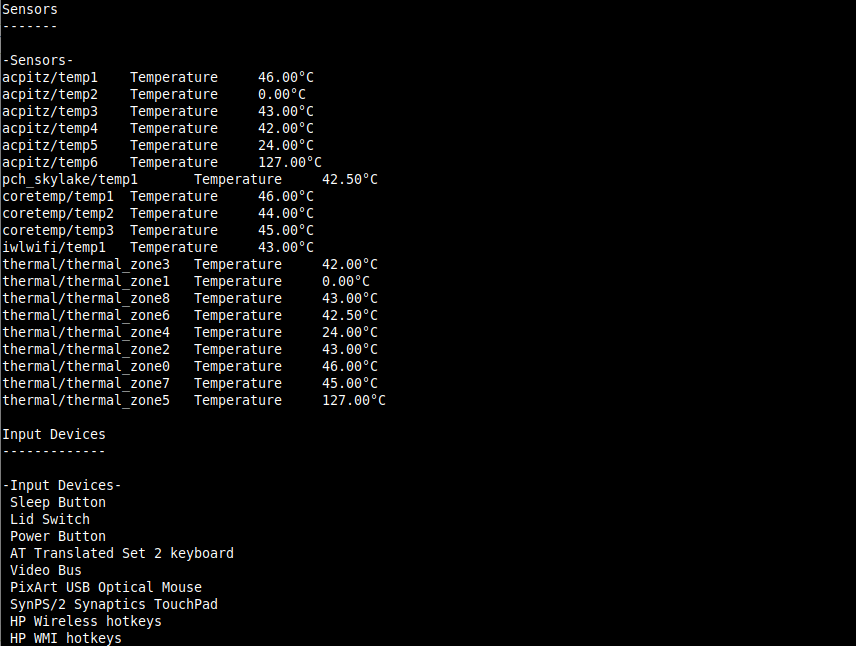
After the installation is complete, you can launch hardinfo to view devices’ information by running the following command.
$ hardinfo -rma devices.so
To launch the GUI app, simply run the following command or search for ‘System Profiler and Benchmark’ in the system menu or Dash and open it.
$ hardinfo
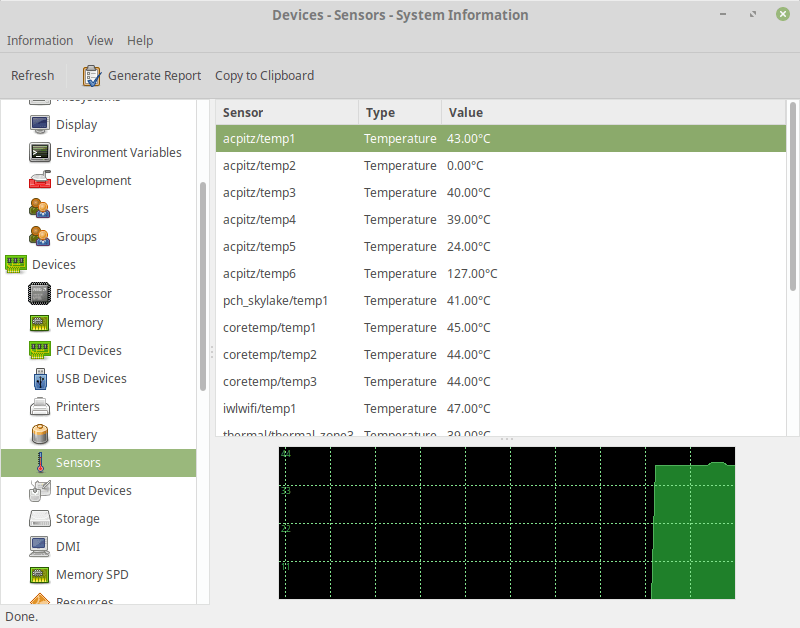
Then click on sensors to view sensors information as shown in the following screenshot.
4. i7z
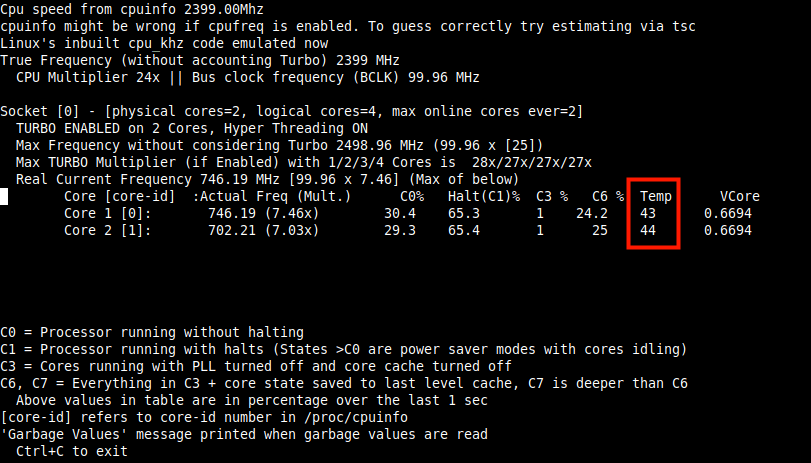
i7z is a tiny command-line utility that reports Intel Core i7, i5, i3 CPU information including temperatures. You can install it on your Ubuntu system by running the following command.
$ sudo apt install i7z
Once installed, run i7z with root privileges as shown.
$ sudo i7z
You might also like to read these useful related articles.
- Limit CPU Usage of a Process in Linux with CPULimit Tool
- 9 Useful Commands to Get CPU Information on Linux
- Cpustat – Monitors CPU Utilization by Running Processes in Linux
- CoreFreq – A Powerful CPU Monitoring Tool for Linux Systems
That’s all for now! In this article, we have shared the useful command-line tools for viewing CPU and GPU temperatures in a Ubuntu system. Have your say about this article or ask questions via the feedback form below.




There’s also graphics sensors, like Vitals.
None of these work in Debian 11.6, all refer to python-dev and that is no longer “good“.
I get a message||
Redirecting output to ‘wget-log.3’.
Detected system: Debian
sudo apt-get install -y python3-pip python-dev python3-docker gcc lm-sensors wireless-tools
Reading package lists… Done
Building dependency tree… Done
Reading state information… Done
Package python-dev is not available, but is referred to by another package.
This may mean that the package is missing, has been obsoleted, or
is only available from another source
However the following packages replace it:
python-dev-is-python3
E: Package ‘python-dev’ has no installation candidate
@Roman,
Try to install Python3, which contains python-dev as well.
At least in the current version of glances, the button for sensor data is
's'not'f', ‘f’ is filesystem.One “trick” I use with the ‘sensors‘ command is to combine it with the ‘watch‘ command in a dedicated terminal window:
This will refresh every 2 seconds (the watch default). I resize the window to just fit the data and alt-tab to it when I want to see my system/cpu temps at a glance.
You can change the interval time on the watch command:
It every 4 seconds, etc.
Thanks for this proposal, it is very useful for me…
@dragonmouth
Thanks for sharing your concerns with us. We shall pull this into consideration.
I use Hardinfo for many things like identifying hardware and systems or identifying boot problem, but for constant temp readouts in
CorFI use a GUI, GKrellM system monitor.@Jim
Many thank for sharing your thoughts with us.
These utilities can be installed and used perfectly well in almost all Linux distributions, not just Ubuntu. You have also written articles about packages that are available only in Ubuntu PPAs and declared them usable in all of Linux.
You, and many others, have a penchant for making Ubuntu sound like the only Linux distro in existence. Ubuntu IS NOT the alpha and omega of Linux. It is not even close to being the most popular distro.
How about some truth in labeling? If the article is distro-specific, say so in the title. If the article is not distro-specific, says that in the title. You will not lose readers. In fact, you may gain them.
@dragonmouth
Thanks for sharing your concerns with us. We shall pull this into consideration.