Netdata is a free open-source, simple, and scalable, real-time system performance and health monitoring application for Unix-like systems such as Linux, FreeBSD, and MacOS.
It gathers various metrics and visualizes them, allowing you to watch operations on your system. It supports various plugins for monitoring current system status, running applications, and services such as MySQL database server, plus lots more.
In this article, we will explain how to monitor MySQL database server performance using Netdata on RHEL-based distributions.
At the end of this article, you will be able to watch visualizations of bandwidth, queries, handlers, locks, issues, temporaries, connections, binlog, threads metrics of your MySQL database server from a netdata monitoring web interface.
Step 1: Install MySQL Database Server in Linux
If you don’t have MySQL or MariaDB installed on your RHEL-based distribution, you can easily install one of them before setting up Netdata for monitoring.
Installing MySQL Database Server
sudo yum localinstall https://dev.mysql.com/get/mysql80-community-release-el9-1.noarch.rpm
sudo yum install mysql-community-server -y
sudo systemctl start mysqld
sudo systemctl enable mysqld
sudo grep 'temporary password' /var/log/mysqld.log
sudo mysql_secure_installation
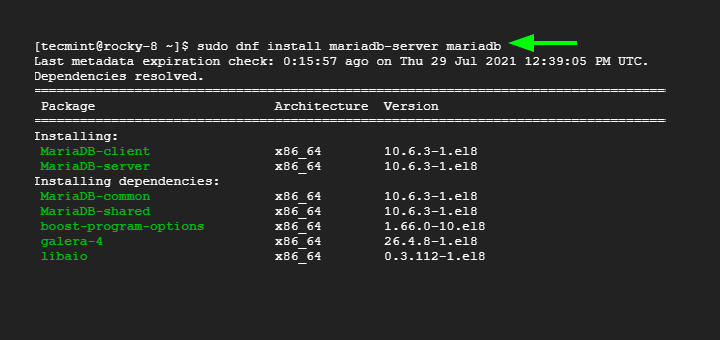
Installing MariaDB Database Server
sudo yum install mariadb-server -y
sudo systemctl start mariadb
sudo systemctl enable mariadb
sudo mysql_secure_installation
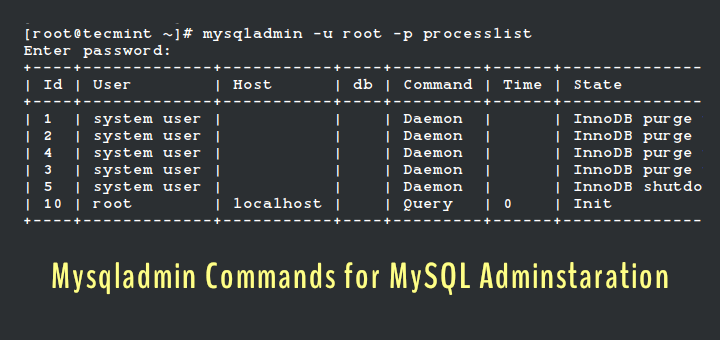
To collect performance statistics from your MySQL/MariaDB database server, netdata needs to connect to the database server. So create a database user called “netdata” to give it the ability to connect to the database server on localhost, without a password.
mysql -u root -p
CREATE USER 'netdata'@'localhost';
GRANT USAGE on *.* to 'netdata'@'localhost';
FLUSH PRIVILEGES;
exit;
Step 2: Install Netdata to Monitor MySQL Performance
Luckily, we already have a one-liner kickstart script provided by the developers of netdata, for painlessly installing it from the source tree on the github repository.
The kickstarter script downloads another script for detecting your Linux distro; installs the required system packages for building netdata; then downloads the latest netdata source tree; builds and installs it on your system.
This command will help you launch the kickstarter script, and allow for installing the required packages for all netdata plugins including the ones for MySQL/MariaDB.
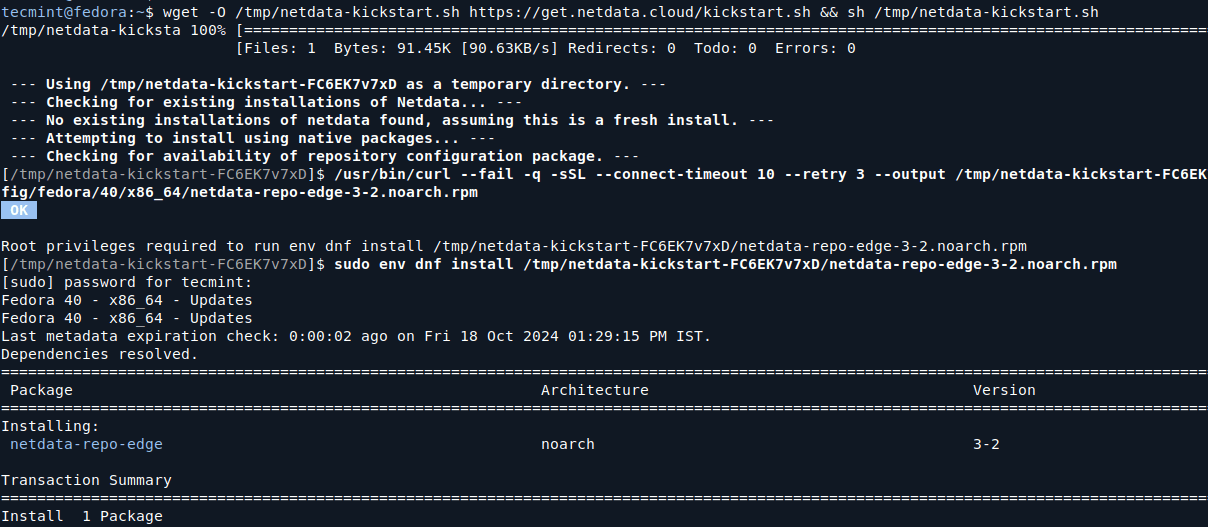
wget -O /tmp/netdata-kickstart.sh https://get.netdata.cloud/kickstart.sh && sh /tmp/netdata-kickstart.sh
If you are not managing your system as root, you will be prompted to enter your user password for the sudo command, and you will also be asked to confirm a number of functions by simply pressing [Enter].
Once the script has completed building and installing netdata, you can start the netdata service and enable it to start at system boot.
sudo systemctl start netdata
sudo systemctl enable netdata
Netdata listens on port 19999 by default, you will use this port to access the web UI. So, open the port on your system firewall.
sudo firewall-cmd --permanent --add-port=19999/tcp
sudo firewall-cmd --reload
Step 3: Configure Netdata to Monitor MySQL/MariaDB
The default configuration is just enough to get you started with monitoring your MySQL/MariaDB database server. In case you have read the documentation, and made any changes to the above file, you need to restart the netdata service to effect the changes.
sudo systemctl restart netdata
Next, open a web browser and use any of the following URLs to access the netdata web UI.
http://domain_name:19999
OR
http://SERVER_IP:19999
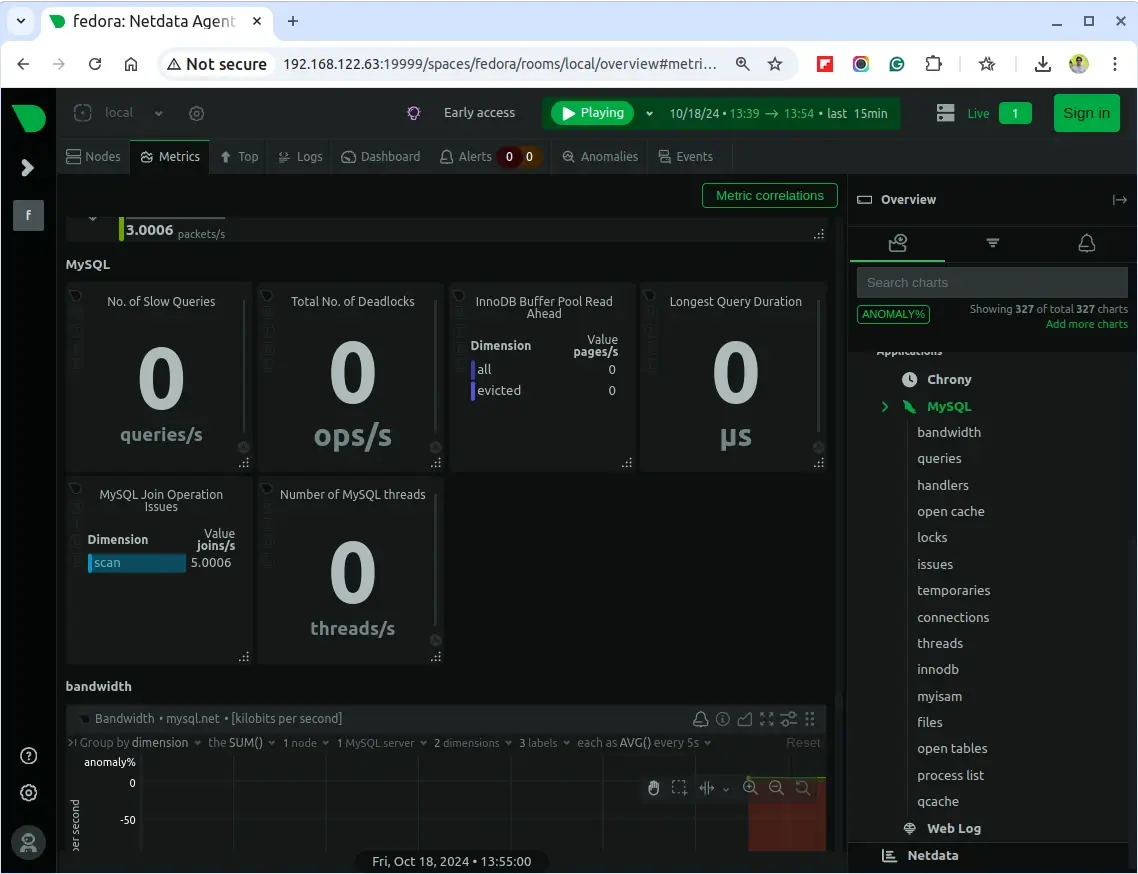
From the netdata dashboard, search for “MySQL local” on the right-hand side list of plugins, and click on it to start monitoring your MySQL/MariaDB server. You will be able to watch visualizations of bandwidth, queries, handlers, locks, as well as galera, as shown in the following screenshot.
Netdata Github repository: https://github.com/netdata/netdata
That’s all! In this article, we have explained how to monitor MySQL/MariaDB database server performance using Netdata on RedHat-based systems. Use the comment form below to ask questions or share additional thoughts with us.


I’ve installed netdata but how do you actually install the plugin from the kickstart method? Do you just get the files from github and put them in the right path and then customize the config file?
Hi Ravi,
Thanks for a very informative article!
I just wanted to add that an easy way to monitor your MySQL and MariaDB instances is to use an agentless tool. In my work as an IT developer I have a few databases that require monitoring. I have been using Navicat Monitor for MySQL/ MariaDB for about a year now and have been quite impressed by it.
I would highly recommend going the agentless route because it allows you to monitor your DB instances from anywhere without having to install any software on the server. That leaves all of its processing cycles free to manage database transactions.
Another plus for me is that you can get an overview of all of your instances on one screen. From there, you can drill down to get more details about a particular instance.
I’ve recently been working with Amazon RDS and Google Cloud and have found Navicat to be superior to the native tools that come with the Cloud services.
Basically, if a device can connect to the Internet, you can monitor your MySQL/ MariaDB databases using Navicat.
Thanks again for a very in-depth article!
Best regards,
Rob Gravelle